第12章線形回帰と相関
12.6 Outliers12.6 外れ値
In some data sets, there are values (observed data points) called outliers. Outliers are observed data points that are far from the least squares line. They have large "errors", where the "error" or residual is the vertical distance from the line to the point.
データ集合には、外れ値と呼ばれる値(観測されたデータ点)が含まれることがある。外れ値は、最小二乗直線から遠く離れた観測点である。大きな「誤差」を持ち、この誤差または残差は、直線から点までの垂直距離を表す。
Outliers need to be examined closely. Sometimes, for some reason or another, they should not be included in the analysis of the data. It is possible that an outlier is a result of erroneous data. Other times, an outlier may hold valuable information about the population under study and should remain included in the data. The key is to examine carefully what causes a data point to be an outlier.
英語のヒント
外れ値は詳しく調べる必要がある。何らかの理由でデータの分析に含めるべきではない場合もある。外れ値が誤ったデータから生じた可能性もあるからだ。逆に、外れ値が研究対象の母集団について貴重な情報を持ち、データに残すべき場合もある。重要なのは、何がその点を外れ値にしているのかを慎重に調べることである。
Besides outliers, a sample may contain one or a few points that are called influential points. Influential points are observed data points that are far from the other observed data points in the horizontal direction. These points may have a big effect on the slope of the regression line. To begin to identify an influential point, you can remove it from the data set and see if the slope of the regression line is changed significantly.
英語のヒント
外れ値とは別に、標本には影響点と呼ばれる点が一つまたは少数含まれることがある。影響点は、水平方向にほかの観測点から遠く離れた点である。これらの点は、回帰直線の傾きに大きく影響することがある。影響点を特定するには、まずその点をデータ集合から外し、回帰直線の傾きが大きく変わるかを確かめるとよい。
Computers and many calculators can be used to identify outliers from the data. Computer output for regression analysis will often identify both outliers and influential points so that you can examine them.
コンピューターや多くの電卓で、データの外れ値を特定できる。回帰分析の出力では、外れ値と影響点の両方が示されることが多く、それらを詳しく調べられる。
Identifying Outliers外れ値の特定
We could guess at outliers by looking at a graph of the scatterplot and best fit-line. However, we would like some guideline as to how far away a point needs to be in order to be considered an outlier. As a rough rule of thumb, we can flag any point that is located further than two standard deviations above or below the best-fit line as an outlier. The standard deviation used is the standard deviation of the residuals or errors.
英語のヒント
散布図と最適直線を見て、外れ値を推測することはできる。しかし、外れ値とみなすには点がどのくらい離れていればよいか、何らかの目安がほしい。おおまかな経験則として、最適直線から上または下へ標準偏差の2倍を超えて離れた点を、外れ値として印を付けられる。ここで使う標準偏差は、残差または誤差の標準偏差である。
We can do this visually in the scatter plot by drawing an extra pair of lines that are two standard deviations above and below the best-fit line. Any data points that are outside this extra pair of lines are flagged as potential outliers. Or we can do this numerically by calculating each residual and comparing it to twice the standard deviation. On the TI-83, 83+, or 84+, the graphical approach is easier. The graphical procedure is shown first, followed by the numerical calculations. You would generally need to use only one of these methods.
散布図では、最適直線の上下に標準偏差の2倍だけ離れた直線を1本ずつ加えることで、視覚的に判定できる。この2本の外側にある点を、外れ値の候補として印付けする。また、各残差を計算して標準偏差の2倍と比較すれば、数値的にも判定できる。TI-83、83+、84+では図を使う方法のほうが簡単である。まず図による手順を示し、その後に数値計算を示す。通常は、どちらか一つを使えばよい。
Example 12.12例題 12.12
In the third exam/final exam example, you can determine if there is an outlier or not. If there is an outlier, as an exercise, delete it and fit the remaining data to a new line. For this example, the new line ought to fit the remaining data better. This means the SSE should be smaller and the correlation coefficient ought to be closer to 1 or –1.
「第3回試験と期末試験の例」で、外れ値があるかを調べられる。外れ値があれば、練習として削除し、残りのデータに新しい直線を当てはめよう。この例では、新しい直線は残りのデータによりよく適合するはずである。つまり、SSEは小さく、相関係数は1または−1に近くなるはずである。
Solution解き方
Graphical Identification of Outliersグラフによる外れ値の特定
With the TI-83, 83+, 84+ graphing calculators, it is easy to identify the outliers graphically and visually. If we were to measure the vertical distance from any data point to the corresponding point on the line of best fit and that distance were equal to 2s or more, then we would consider the data point to be "too far" from the line of best fit. We need to find and graph the lines that are two standard deviations below and above the regression line. Any points that are outside these two lines are outliers. We will call these lines Y2 and Y3:
TI-83、83+、84+グラフ電卓を使うと、外れ値を図で容易に確認できる。データ点と、最適直線上の対応する点の垂直距離を測り、その距離が2s以上なら、その点は最適直線から「遠すぎる」とみなす。回帰直線から上下に標準偏差の2倍だけ離れた直線を求め、描く必要がある。この2本の外側にある点が外れ値である。これらの直線をY2、Y3と呼ぶ。
As we did with the equation of the regression line and the correlation coefficient, we will use technology to calculate this standard deviation for us. Using the LinRegTTest with this data, scroll down through the output screens to find s = 16.412.
回帰方程式や相関係数と同じように、この標準偏差も機器を使って計算する。このデータでLinRegTTestを実行し、出力画面を下へスクロールするとs = 16.412が見つかる。
Line Y2 = –173.5 + 4.83x –2(16.4) and line Y3 = –173.5 + 4.83x + 2(16.4)
where ŷ = –173.5 + 4.83x is the line of best fit. Y2 and Y3 have the same slope as the line of best fit.
where ŷ = –173.5 + 4.83x is the line of best fit. Y2 and Y3 have the same slope as the line of best fit.
直線Y2 = −173.5 + 4.83x − 2(16.4)、直線Y3 = −173.5 + 4.83x + 2(16.4)。ここで、ŷ = −173.5 + 4.83xが最適な当てはめ直線である。Y2とY3の傾きは最適直線と同じである。
Graph the scatterplot with the best fit line in equation Y1, then enter the two extra lines as Y2 and Y3 in the "Y="equation editor and press ZOOM 9. You will find that the only data point that is not between lines Y2 and Y3 is the point x = 65, y = 175. On the calculator screen it is just barely outside these lines. The outlier is the student who had a grade of 65 on the third exam and 175 on the final exam; this point is further than two standard deviations away from the best-fit line.
英語のヒント
散布図と、Y1に入力した最適直線を描く。次に「Y=」編集画面で追加の2直線をY2、Y3に入力し、ZOOM、9を押す。Y2とY3の間にない唯一の点は、x = 65、y = 175であると分かる。電卓画面では、線のすぐ外側に見える。この外れ値は、第3回試験が65点、期末試験が175点だった学生である。この点は最適直線から標準偏差の2倍を超えて離れている。
Sometimes a point is so close to the lines used to flag outliers on the graph that it is difficult to tell if the point is between or outside the lines. On a computer, enlarging the graph may help; on a small calculator screen, zooming in may make the graph clearer. Note that when the graph does not give a clear enough picture, you can use the numerical comparisons to identify outliers.
点が外れ値判定用の線に非常に近く、2本の間か外側かを見分けにくいことがある。コンピューターではグラフの拡大が役立ち、電卓の小さな画面ではズームすると明確になる場合がある。グラフでは十分にはっきりしないときは、数値を比較して外れ値を特定できることを覚えておこう。
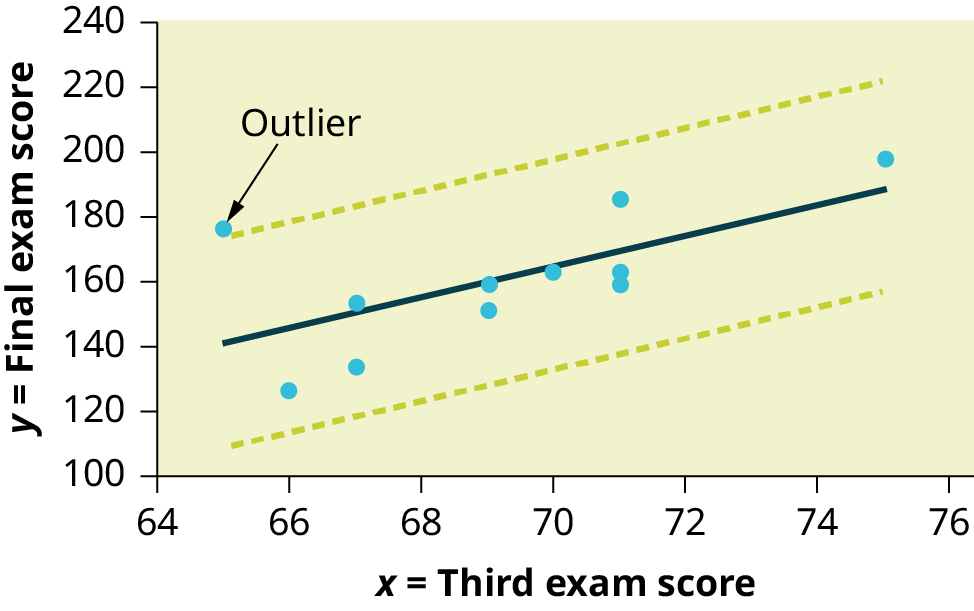

Figure 12.27図 12.27