第12章線形回帰と相関
12.1 Linear Equations12.1 一次方程式
Linear regression for two variables is based on a linear equation with one independent variable. The equation has the form:
二つの変数の線形回帰は、独立変数が一つの一次方程式に基づく。その方程式は次の形をとる。
where a and b are constant numbers.
ここで、aとbは定数である。
The variable x is the independent variable, and y is the dependent variable. Typically, you choose a value to substitute for the independent variable and then solve for the dependent variable.
英語のヒント
変数xは独立変数、yは従属変数である。通常は、独立変数に代入する値を選び、その後に従属変数の値を求める。
Example 12.1例題 12.1
The following examples are linear equations.
次は一次方程式の例である。
The graph of a linear equation of the form y = a + bx is a straight line. Any line that is not vertical can be described by this equation.
英語のヒント
y = a + bxという形の一次方程式のグラフは直線である。垂直でない直線はどれも、この方程式で表せる。
Example 12.2例題 12.2
Graph the equation y = –1 + 2x.
方程式y = −1 + 2xのグラフを描こう。
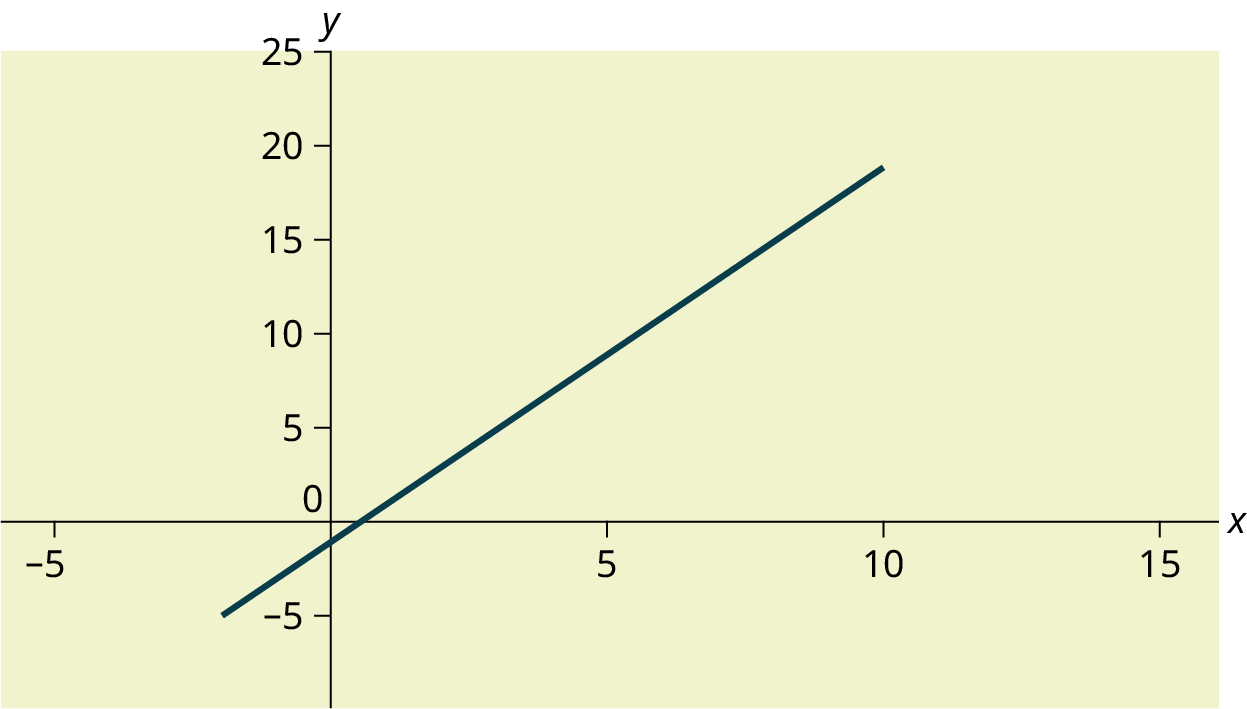
Figure 12.2図 12.2
Example 12.3例題 12.3
A local small business completes federal tax returns for customers. The rate for services is $32 per hour plus a $31.50 one-time charge. The total cost to a customer depends on the number of hours it takes to complete the job.
英語のヒント
地元の小さな会社が、顧客の連邦税の確定申告書を作成している。料金は1時間32ドルに、1回限りの手数料31.50ドルを加えた額である。顧客の総費用は、仕事の完了にかかる時間数によって決まる。
Find the equation that expresses the total cost in terms of the number of hours required to complete the job.
仕事の完了に必要な時間数を使って、総費用を表す方程式を求めよう。
Solution解き方
Let x = the number of hours it takes to get the job done.
Let y = the total cost to the customer.
Let y = the total cost to the customer.
xを仕事の完了にかかる時間数、yを顧客の総費用とする。
The $31.50 is a fixed cost. If it takes x hours to complete the tax return, then (32)(x) is the cost of the tax return processing only. The total cost is: y = 31.50 + 32x
31.50ドルは固定費である。確定申告書の作成にx時間かかるなら、(32)(x)は申告処理だけの費用である。総費用はy = 31.50 + 32xとなる。
Slope and Y-Intercept of a Linear Equation一次方程式の傾きとy切片
For the linear equation y = a + bx, b = slope and a = y-intercept. From algebra recall that the slope is a number that describes the steepness of a line, and the y-intercept is the y coordinate of the point (0, a) where the line crosses the y-axis.
英語のヒント
一次方程式y = a + bxでは、bが傾き、aがy切片である。代数で学んだように、傾きは直線の傾斜の程度を表す数であり、y切片は直線がy軸と交わる点(0, a)のy座標である。
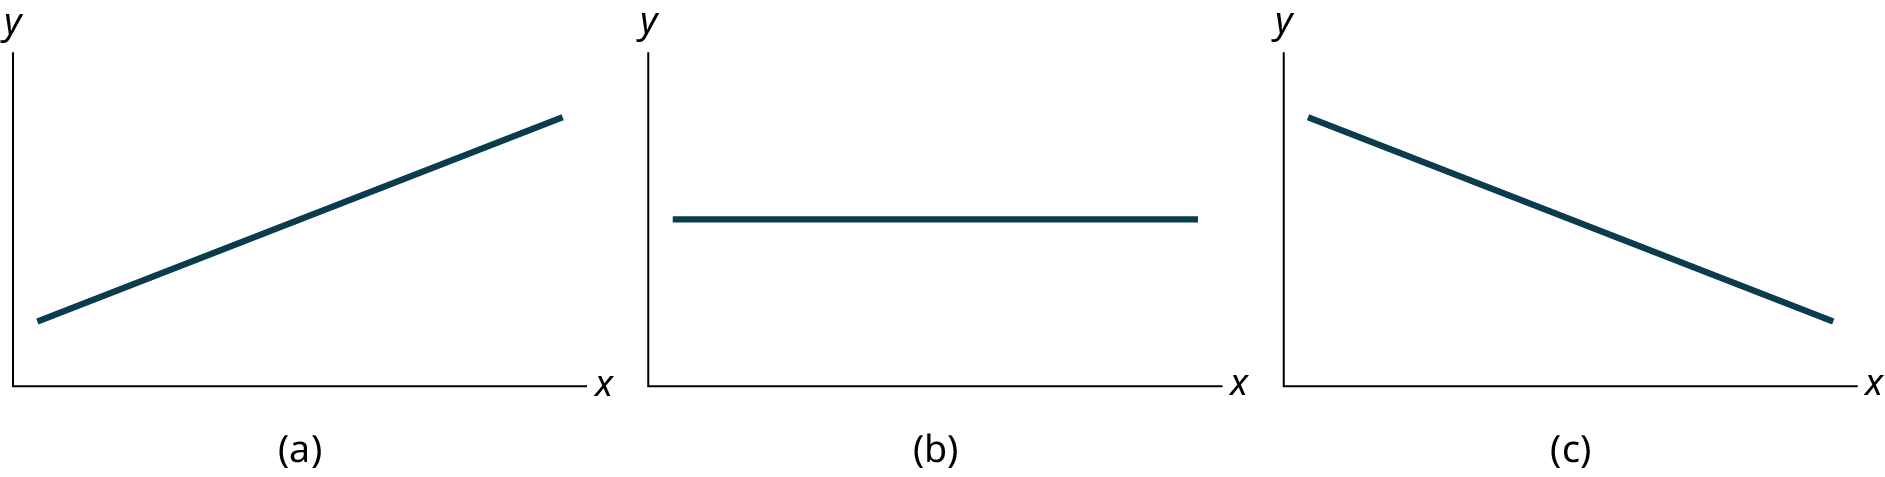


Figure 12.4図 12.4
Three possible graphs of y = a + bx. (a) If b > 0, the line slopes upward to the right. (b) If b = 0, the line is horizontal. (c) If b < 0, the line slopes downward to the right.
y = a + bxがとりうる三つのグラフ。(a)b > 0なら右上がり。(b)b = 0なら水平。(c)b < 0なら右下がり。
Example 12.4例題 12.4
Svetlana tutors to make extra money for college. For each tutoring session, she charges a one-time fee of $25 plus $15 per hour of tutoring. A linear equation that expresses the total amount of money Svetlana earns for each session she tutors is y = 25 + 15x.
英語のヒント
スヴェトラーナは大学費用を補うため、個別指導をしている。1回の指導につき、基本料金25ドルに、指導1時間あたり15ドルを加えて請求する。1回の指導で稼ぐ総額を表す一次方程式は、y = 25 + 15xである。
What are the independent and dependent variables? What is the y-intercept and what is the slope? Interpret them using complete sentences.
独立変数と従属変数は何か。y切片と傾きはいくつか。それぞれを完全な文章で解釈しよう。
Solution解き方
The independent variable (x) is the number of hours Svetlana tutors each session. The dependent variable (y) is the amount, in dollars, Svetlana earns for each session.
独立変数xは、スヴェトラーナが1回に指導する時間数である。従属変数yは、1回の指導で稼ぐ金額(ドル)である。
The y-intercept is 25 (a = 25). At the start of the tutoring session, Svetlana charges a one-time fee of $25 (this is when x = 0). The slope is 15 (b = 15). For each session, Svetlana earns $15 for each hour she tutors.
y切片は25である(a = 25)。指導の開始時に、スヴェトラーナは1回限りの料金25ドルを請求する(この時点でx = 0である)。傾きは15である(b = 15)。毎回の指導で、1時間につき15ドルを稼ぐ。
References参考文献
Data from the Centers for Disease Control and Prevention.
データ出典:米国疾病予防管理センター。
Data from the National Center for agency reporting flu cases and TB Prevention.
データ出典:インフルエンザ症例報告および結核予防を担当する国立センター。
Chapter Review章の復習
The most basic type of association is a linear association. This type of relationship can be defined algebraically by the equations used, numerically with actual or predicted data values, or graphically from a plotted curve. (Lines are classified as straight curves.) Algebraically, a linear equation typically takes the form y = mx + b, where m and b are constants, x is the independent variable, y is the dependent variable. In a statistical context, a linear equation is written in the form y = a + bx, where a and b are the constants. This form is used to help readers distinguish the statistical context from the algebraic context. In the equation y = a + bx, the constant b, called a coefficient, represents the slope. The constant a is called the y-intercept.
英語のヒント
最も基本的な関連は線形の関連である。この関係は、方程式によって代数的に、実測値や予測値によって数値的に、あるいは描いた曲線によってグラフとして表せる。(直線は真っすぐな曲線に分類される。)代数では、一次方程式は通常y = mx + bと書く。mとbは定数、xは独立変数、yは従属変数である。統計ではy = a + bxと書き、aとbが定数となる。この形は、統計の文脈と代数の文脈を読者が区別しやすくするために使われる。方程式y = a + bxでは、係数と呼ばれる定数bが傾きを表す。定数aはy切片と呼ばれる。
The slope of a line is a value that describes the rate of change between the independent and dependent variables. The slope tells us how the dependent variable (y) changes for every one unit increase in the independent (x) variable, on average. The y-intercept is used to describe the dependent variable when the independent variable equals zero.
直線の傾きは、独立変数と従属変数の間の変化率を表す値である。独立変数xが1単位増えるごとに、従属変数yが平均してどのように変化するかを示す。y切片は、独立変数が0のときの従属変数を表すために使う。