第1章関数とグラフ
1.2 Basic Classes of Functions1.2 関数の基本的な分類
Learning Objectives学習目標
- Calculate the slope of a linear function and interpret its meaning.1次式の関数の傾きを計算し、その意味を説明する。
- Recognize the degree of a polynomial.多項式の次数を見分ける。
- Find the roots of a quadratic polynomial.2次多項式の零点を求める。
- Describe the graphs of basic odd and even polynomial functions.基本的な偶関数・奇関数である多項式のグラフを説明する。
- Identify a rational function.有理関数を見分ける。
- Describe the graphs of power and root functions.べき関数とべき根の関数のグラフを説明する。
- Explain the difference between algebraic and transcendental functions.代数関数と超越関数の違いを説明する。
- Graph a piecewise-defined function.区分的に定義された関数のグラフを描く。
- Sketch the graph of a function that has been shifted, stretched, or reflected from its initial graph position.もとのグラフを平行移動、拡大縮小、反転した関数のグラフを描く。
We have studied the general characteristics of functions, so now let’s examine some specific classes of functions. We begin by reviewing the basic properties of linear and quadratic functions, and then generalize to include higher-degree polynomials. By combining root functions with polynomials, we can define general algebraic functions and distinguish them from the transcendental functions we examine later in this chapter. We finish the section with examples of piecewise-defined functions and take a look at how to sketch the graph of a function that has been shifted, stretched, or reflected from its initial form.
英語のヒント
関数に共通する特徴を学んだので、今度はいくつかの具体的な種類の関数を調べよう。まず1次関数と2次関数の基本的な性質を復習し、そのあとで次数の高い多項式へと一般化する。べき根の関数と多項式を組み合わせると、一般の代数関数を定義できる。これを、この章の後半で調べる超越関数と区別する。この節の最後では、区分的に定義された関数の例を取り上げる。また、もとの形を平行移動、拡大・縮小、反転させた関数のグラフをどのように描くかを調べる。
Linear Functions and Slope1次式の関数と傾き
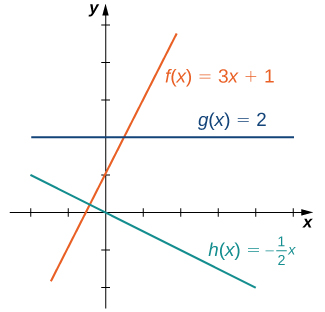
The easiest type of function to consider is a linear function. Linear functions have the form where and are constants. In Figure 1.15, we see examples of linear functions when is positive, negative, and zero. Note that if the graph of the line rises as increases. In other words, is increasing on If the graph of the line falls as increases. In this case, is decreasing on If the line is horizontal.
最も扱いやすい関数は、1次式で表される関数である。その形はで、とは定数である。ここでは傾きが0の定数関数も含めて扱う。図1.15には、が正、負、0の場合の例がある。なら、が増えるにつれて直線のグラフは上がる。つまり、はで増加する。なら、が増えるにつれて直線のグラフは下がる。この場合、はで減少する。なら、直線は水平である。
OpenStax, Rice University; Calculus Volume 1. · CC BY-NC-SA 4.0
Figure 1.15図 1.15
These linear functions are increasing or decreasing on and one function is a horizontal line.
これらの1次式の関数はで増加または減少し、1つは水平な直線である。
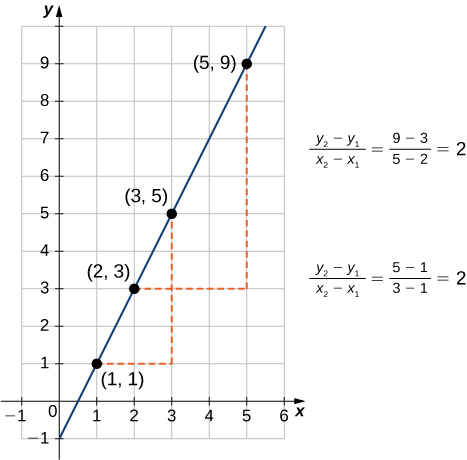
As suggested by Figure 1.15, the graph of any linear function is a line. One of the distinguishing features of a line is its slope. The slope is the change in for each unit change in The slope measures both the steepness and the direction of a line. If the slope is positive, the line points upward when moving from left to right. If the slope is negative, the line points downward when moving from left to right. If the slope is zero, the line is horizontal. To calculate the slope of a line, we need to determine the ratio of the change in versus the change in To do so, we choose any two points and on the line and calculate In Figure 1.16, we see this ratio is independent of the points chosen.
英語のヒント
OpenStax, Rice University; Calculus Volume 1. · CC BY-NC-SA 4.0
Figure 1.16図 1.16
For any linear function, the slope is independent of the choice of points and on the line.
1次式の関数では、傾きは直線上の2点、の選び方によらない。
We now examine the relationship between slope and the formula for a linear function. Consider the linear function given by the formula As discussed earlier, we know the graph of a linear function is given by a line. We can use our definition of slope to calculate the slope of this line. As shown, we can determine the slope by calculating for any points and on the line. Evaluating the function at we see that is a point on this line. Evaluating this function at we see that is also a point on this line. Therefore, the slope of this line is
英語のヒント
次に、傾きと1次式の関数の公式との関係を調べる。関数を考えよう。先に述べたとおり、そのグラフは直線になる。傾きの定義から、この直線の傾きを計算できる。直線上の任意の2点、に対してを計算すればよい。関数のでの値を求めると、がこの直線上の点だとわかる。での値を求めると、も直線上の点である。したがって、直線の傾きは次のようになる。
We have shown that the coefficient is the slope of the line. We can conclude that the formula describes a line with slope Furthermore, because this line intersects the -axis at the point we see that the -intercept for this linear function is We conclude that the formula tells us the slope, and the -intercept, for this line. Since we often use the symbol to denote the slope of a line, we can write
英語のヒント
係数が直線の傾きであることが示された。つまり、は傾きの直線を表す。さらに、この直線は軸と点で交わるので、切片を表す交点はである。したがって、式から、この直線の傾きと、切片を表す交点がわかる。直線の傾きには記号を使うことが多いため、次のように書ける。
to denote the slope-intercept form of a linear function.
これを1次式の関数の傾き・切片の形という。
Sometimes it is convenient to express a linear function in different ways. For example, suppose the graph of a linear function passes through the point and the slope of the line is Since any other point on the graph of must satisfy the equation
1次式の関数は、別の形で表すと便利な場合もある。たとえば、そのグラフが点を通り、直線の傾きがだとする。のグラフ上のほかの点は、どれも次の式を満たさなければならない。
this linear function can be expressed by writing
したがって、この関数は次のように表せる。
We call this equation the point-slope equation for that linear function.
英語のヒント
これを1次式の関数の点・傾きの形という。
Since every nonvertical line is the graph of a linear function, the points on a nonvertical line can be described using the slope-intercept or point-slope equations. However, a vertical line does not represent the graph of a function and cannot be expressed in either of these forms. Instead, a vertical line is described by the equation for some constant Since neither the slope-intercept form nor the point-slope form allows for vertical lines, we use the notation
英語のヒント
垂直でない直線はどれも1次式の関数のグラフになるので、その上の点は傾き・切片の形や点・傾きの形の方程式で表せる。しかし、垂直な直線は関数のグラフではなく、このどちらの形でも表せない。垂直な直線は、定数を使ってと表す。傾き・切片の形も点・傾きの形も垂直な直線を扱えないので、次の表記を用いる。
where are both not zero, to denote the standard form of a line.
ここで、は同時には0でない。この形を直線の標準形という。
Example 1.12例題 1.12
Finding the Slope and Equations of Lines直線の傾きと方程式を求める
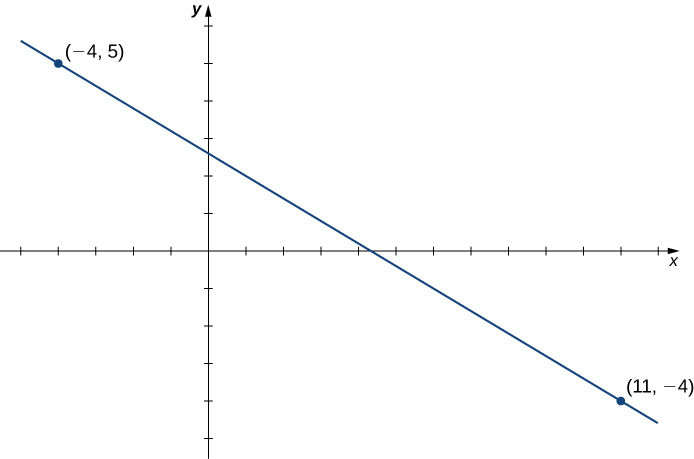
Consider the line passing through the points and as shown in Figure 1.17.
図1.17のように、2点、を通る直線を考える。
OpenStax, Rice University; Calculus Volume 1. · CC BY-NC-SA 4.0
Figure 1.17図 1.17
Finding the equation of a linear function with a graph that is a line between two given points.
与えられた2点を通る直線をグラフにもつ、1次式の関数の式を求める。
- Find the slope of the line.直線の傾きを求めよ。
- Find an equation for this linear function in point-slope form.この関数の式を、点・傾きの形で求めよ。
- Find an equation for this linear function in slope-intercept form.この関数の式を、傾き・切片の形で求めよ。
Solution解き方
- The slope of the line is直線の傾きは、次のとおりである。
- To find an equation for the linear function in point-slope form, use the slope and choose any point on the line. If we choose the point we get the equation点・傾きの形を求めるには、傾きと、直線上の任意の1点を使う。点を選ぶと、次の式を得る。
- To find an equation for the linear function in slope-intercept form, solve the equation in part b. for When we do this, we get the equation傾き・切片の形を求めるには、bの式をについて解けばよい。次の式を得る。
Example 1.13例題 1.13
A Linear Distance Function走行距離を表す1次式の関数
Jessica leaves her house at 5:50 a.m. and goes for a 9-mile run. She returns to her house at 7:08 a.m. Answer the following questions, assuming Jessica runs at a constant pace.
英語のヒント
ジェシカは午前5時50分に家を出て、9マイルのランニングをし、午前7時8分に帰宅する。一定のペースで走るものとして、次の問いに答えよ。
- Describe the distance (in miles) Jessica runs as a linear function of her run time (in minutes).ジェシカが走った距離(マイル)を、走り始めてからの時間(分)の1次式の関数として表せ。
- Sketch a graph ofのグラフの概形を描け。
- Interpret the meaning of the slope.傾きが何を意味するか説明せよ。
Solution解き方
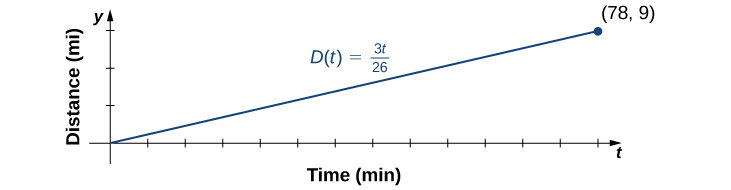
- At time Jessica is at her house, so At time minutes, Jessica has finished running mi, so The slope of the linear function is時刻では家にいるので、である。分の時点では miを走り終えているので、である。この関数の傾きは、次のとおり。
The -intercept is so the equation for this linear function is軸との交点はなので、関数の式は次のようになる。 - To graph use the fact that the graph passes through the origin and has slopeのグラフは、原点を通り、傾きがであることを使って描く。
OpenStax, Rice University; Calculus Volume 1. · CC BY-NC-SA 4.0
- The slope describes the distance (in miles) Jessica runs per minute, or her average velocity.傾きは、ジェシカが1分間に走る距離(マイル)、つまり平均の速さを表す。