第1章関数とグラフ
Zeros of Polynomial Functions多項式関数の零点
Another characteristic of the graph of a polynomial function is where it intersects the -axis. To determine where a function intersects the -axis, we need to solve the equation for x. In the case of the linear function the -intercept is given by solving the equation In this case, we see that the -intercept is given by In the case of a quadratic function, finding the -intercept(s) requires finding the zeros of a quadratic equation: In some cases, it is easy to factor the polynomial to find the zeros. If not, we make use of the quadratic formula.
英語のヒント
多項式関数のグラフが軸とどこで交わるかも、その特徴の1つである。関数が軸と交わる場所を求めるには、方程式をxについて解く。1次関数では、軸との交点を求めるためを解く。その結果、軸との交点はとわかる。2次関数の場合には、軸との交点を求めるため2次方程式の解を求める。多項式を容易に因数分解できれば零点が求まる。そうでなければ、2次方程式の解の公式を使う。
In the case of higher-degree polynomials, it may be more complicated to determine where the graph intersects the -axis. In some instances, it is possible to find the -intercepts by factoring the polynomial to find its zeros. In other cases, it is impossible to calculate the exact values of the -intercepts. However, as we see later in the text, in cases such as this, we can use analytical tools to approximate (to a very high degree) where the -intercepts are located. Here we focus on the graphs of polynomials for which we can calculate their zeros explicitly.
英語のヒント
次数の高い多項式では、グラフと軸との交点を求めることが難しくなる。多項式を因数分解して零点を求めることで、軸との交点がわかる場合もある。それ以外には、軸との交点の厳密な値を計算できない場合もある。しかし、後で学ぶように、そのような場合でも解析の道具を使えば、軸との交点の位置を非常に高い精度で近似できる。ここでは、零点を明示的に計算できる多項式のグラフに注目する。
Example 1.14例題 1.14
Graphing Polynomial Functions多項式関数のグラフを描く
For the following functions a. and b., i. describe the behavior of as ii. find all zeros of and iii. sketch a graph of
次の関数a、bについて、i. のときのの振る舞いを述べ、ii. の零点をすべて求め、iii. のグラフの概形を描け。
Solution解き方
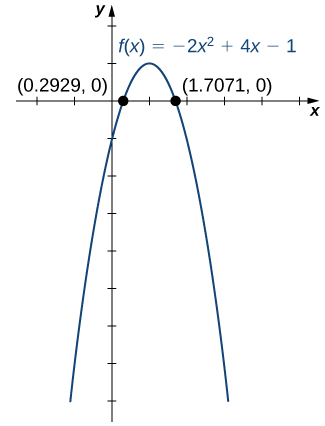
- The function is a quadratic function.関数は2次関数である。
- Becauseとなる。
- To find the zeros of use the quadratic formula. The zeros areの零点を求めるには、2次方程式の解の公式を使う。零点は次のとおり。
- To sketch the graph of use the information from your previous answers and combine it with the fact that the graph is a parabola opening downward.のグラフを描くには、ここまでの結果と、下向きに開く放物線であることを使う。
OpenStax, Rice University; Calculus Volume 1. · CC BY-NC-SA 4.0
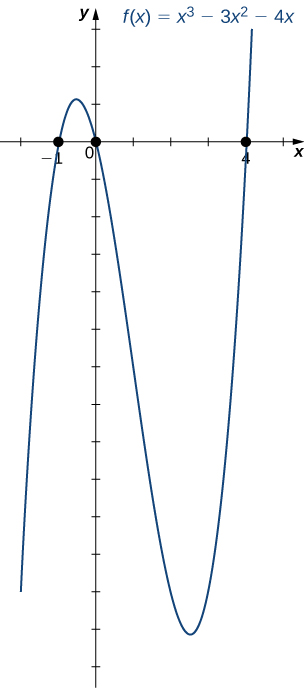
- The function is a cubic function.関数は3次関数である。
- Because Asとなる。また、となる。
- To find the zeros of we need to factor the polynomial. First, when we factor out of all the terms, we findの零点を求めるには、多項式を因数分解する。まず、すべての項からをくくり出すと、次のようになる。
Then, when we factor the quadratic function we find次に、2次式を因数分解すると、次のようになる。
Therefore, the zeros of areしたがって、の零点はである。 - Combining the results from parts i. and ii., draw a rough sketch ofiとiiの結果を合わせて、のグラフの概形を描く。
OpenStax, Rice University; Calculus Volume 1. · CC BY-NC-SA 4.0
Mathematical Models数学モデル
A large variety of real-world situations can be described using mathematical models. A mathematical model is a method of simulating real-life situations with mathematical equations. Physicists, engineers, economists, and other researchers develop models by combining observation with quantitative data to develop equations, functions, graphs, and other mathematical tools to describe the behavior of various systems accurately. Models are useful because they help predict future outcomes. Examples of mathematical models include the study of population dynamics, investigations of weather patterns, and predictions of product sales.
英語のヒント
現実のさまざまな状況は、数学モデルによって記述できる。数学モデルとは、数式を使って現実の状況を再現する方法である。物理学者、技術者、経済学者などの研究者は、観察と数量的なデータを組み合わせ、方程式、関数、グラフなどの数学の道具を作り、さまざまな系の振る舞いを正確に記述する。モデルは将来の結果を予測するのに役立つ。人口動態の研究、気象パターンの調査、商品の売上予測などが数学モデルの例である。
As an example, let’s consider a mathematical model that a company could use to describe its revenue for the sale of a particular item. The amount of revenue a company receives for the sale of items sold at a price of dollars per item is described by the equation The company is interested in how the sales change as the price of the item changes. Suppose the data in Table 1.6 show the number of units a company sells as a function of the price per item.
英語のヒント
例として、ある会社が特定の商品の売上を記述するために使える数学モデルを考えよう。1個ドルの商品を個売ったときの売上は、式で表される。会社は、商品の価格が変わると販売個数がどう変わるかを知りたい。表1.6は、単価を変えたときの販売個数を示すデータとする。
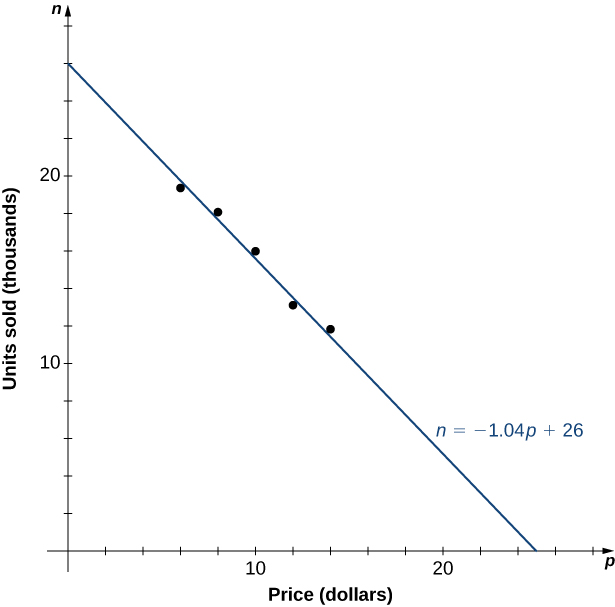
In Figure 1.20, we see the graph the number of units sold (in thousands) as a function of price (in dollars). We note from the shape of the graph that the number of units sold is likely a linear function of price per item, and the data can be closely approximated by the linear function for where predicts the number of units sold in thousands. Using this linear function, the revenue (in thousands of dollars) can be estimated by the quadratic function
英語のヒント
図1.20には、価格(ドル)の関数として販売個数(千個)が描かれている。グラフの形から、販売個数は単価の1次式でほぼ表せると考えられる。このデータは、において1次式の関数でよく近似できる。ここでは、千個単位で予測される販売個数である。この1次式を使うと、売上(千ドル)は次の2次関数で推定できる。
for In Example 1.15, we use this quadratic function to predict the amount of revenue the company receives depending on the price the company charges per item. Note that we cannot conclude definitively the actual number of units sold for values of for which no data are collected. However, given the other data values and the graph shown, it seems reasonable that the number of units sold (in thousands) if the price charged is dollars may be close to the values predicted by the linear function
英語のヒント
この式の範囲はである。例題1.15では、この2次関数を使い、会社が設定する単価に応じて売上がいくらになるかを予測する。データが集められていないの値に対して、実際の販売個数を断定できるわけではない。しかし、ほかのデータと示されたグラフを踏まえると、単価がドルのときの販売個数(千個)は、1次式の関数が予測する値に近いと考えるのは妥当である。
OpenStax, Rice University; Calculus Volume 1. · CC BY-NC-SA 4.0
Figure 1.20図 1.20
The data collected for the number of items sold as a function of price is roughly linear. We use the linear function to estimate this function.
価格と販売個数について集めたデータは、おおよそ直線の関係を示している。1次式の関数を使って近似する。
Example 1.15例題 1.15
Maximizing Revenue売上を最大にする
A company is interested in predicting the amount of revenue it will receive depending on the price it charges for a particular item. Using the data from Table 1.6, the company arrives at the following quadratic function to model revenue (in thousands of dollars) as a function of price per item
ある会社は、特定の商品の設定価格に応じて売上がいくらになるかを予測したい。表1.6のデータから、売上(千ドル)を単価の関数として表す、次の2次関数のモデルを得た。
for
ただし、である。
- Predict the revenue if the company sells the item at a price of and単価をおよびにした場合の売上を予測せよ。
- Find the zeros of this function and interpret the meaning of the zeros.この関数の零点を求め、その意味を説明せよ。
- Sketch a graph ofのグラフの概形を描け。
- Use the graph to determine the value of that maximizes revenue. Find the maximum revenue.グラフを使って、売上を最大にするの値を求めよ。また、売上の最大値を求めよ。
Solution解き方
- Evaluating the revenue function at and we can conclude that売上の関数にとを代入すると、次の結果が得られる。
- The zeros of this function can be found by solving the equation When we factor the quadratic expression, we get The solutions to this equation are given by For these values of the revenue is zero. When the revenue is zero because the company is giving away its merchandise for free. When the revenue is zero because the price is too high, and no one will buy any items.
英語のヒント
この関数の零点は、方程式を解けば求まる。2次式を因数分解するととなり、解はである。がこれらの値のとき、売上は0となる。の場合は商品を無料で配っているため、売上が0になる。の場合は価格が高すぎて誰も買わないため、売上が0になる。 - Knowing the fact that the function is quadratic, we also know the graph is a parabola. Since the leading coefficient is negative, the parabola opens downward. One property of parabolas is that they are symmetric about the axis, so since the zeros are at and the parabola must be symmetric about the line halfway between them, or
英語のヒント
2次関数なので、そのグラフは放物線である。最高次の係数が負なので下向きに開く。放物線はその軸について対称である。零点がとなので、対称軸はその中間を通る直線、すなわちでなければならない。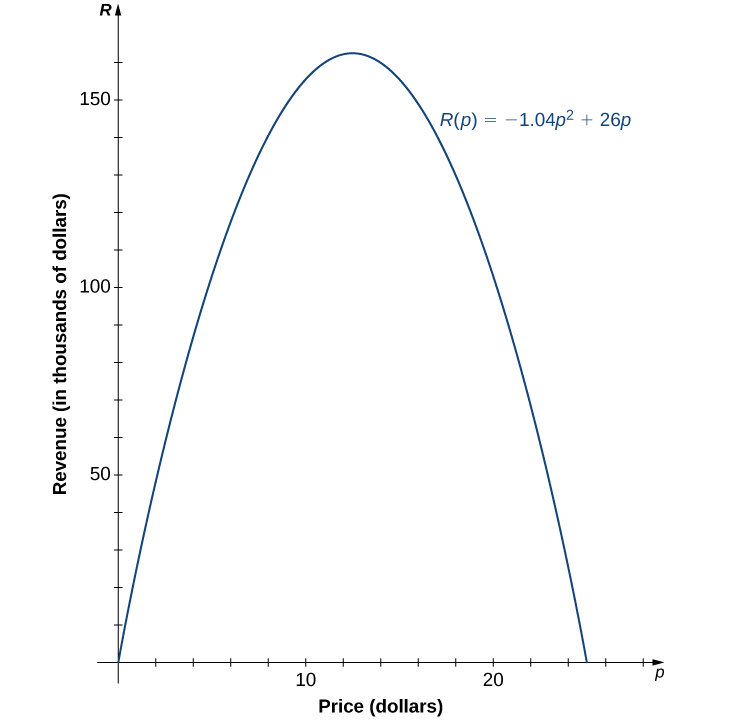
OpenStax, Rice University; Calculus Volume 1. · CC BY-NC-SA 4.0
- The function is a parabola with zeros at and and it is symmetric about the line so the maximum revenue occurs at a price of per item. At that price, the revenue isグラフは零点が、の放物線で、直線について対称である。したがって、単価のとき売上が最大となる。この価格での売上は千ドル、つまり162,500ドルである。