第1章関数とグラフ
Transformations of Functions関数の変換
We have seen several cases in which we have added, subtracted, or multiplied constants to form variations of simple functions. In the previous example, for instance, we subtracted 2 from the argument of the function to get the function This subtraction represents a shift of the function two units to the right. A shift, horizontally or vertically, is a type of transformation of a function. Other transformations include horizontal and vertical scalings, and reflections about the axes.
英語のヒント
ここまでにも、定数を足す、引く、掛けることで、簡単な関数を変形した例がいくつかあった。たとえば先ほどは、関数の引数から2を引いて、関数を作った。この引き算は、のグラフを右に2だけ平行移動することを表す。水平方向・垂直方向の平行移動は、関数の変換の1種である。ほかにも、水平方向・垂直方向の拡大縮小や、座標軸についての対称移動がある。
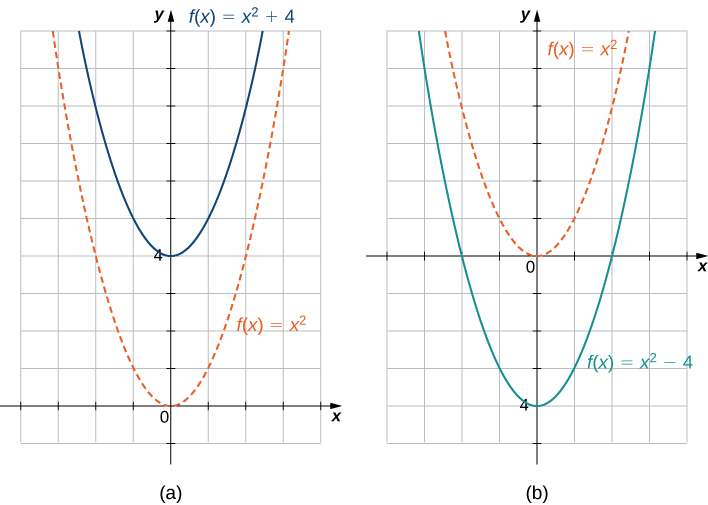
A vertical shift of a function occurs if we add or subtract the same constant to each output For the graph of is a shift of the graph of up units, whereas the graph of is a shift of the graph of down units. For example, the graph of the function is the graph of shifted up units; the graph of the function is the graph of shifted down units (Figure 1.23).
英語のヒント
関数の出力すべてに同じ定数を足す、または引くと、グラフは垂直方向に平行移動する。に対し、のグラフはのグラフを上にだけ移したものとなる。一方、のグラフはのグラフを下にだけ移したものとなる。たとえば、のグラフはを上にだけ平行移動したもの、のグラフはを下にだけ平行移動したものである(図1.23)。
OpenStax, Rice University; Calculus Volume 1. · CC BY-NC-SA 4.0
Figure 1.23図 1.23
(a) For the graph of is a vertical shift up units of the graph of (b) For the graph of is a vertical shift down units of the graph of
(a) のとき、のグラフはのグラフを上にだけ平行移動したものである。(b) のとき、のグラフはのグラフを下にだけ平行移動したものである。
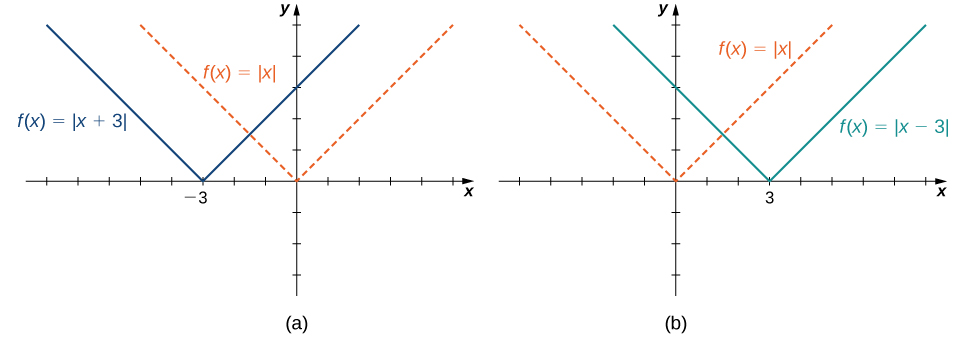
A horizontal shift of a function occurs if we add or subtract the same constant to each input For the graph of is a shift of the graph of to the left units; the graph of is a shift of the graph of to the right units. Why does the graph shift left when adding a constant and shift right when subtracting a constant? To answer this question, let’s look at an example.
関数の入力すべてに同じ定数を足す、または引くと、グラフは水平方向に平行移動する。に対して、のグラフはのグラフを左にだけ移したもの、のグラフはのグラフを右にだけ移したものとなる。定数を足すと左へ、引くと右へ動くのはなぜだろうか。例で考えてみよう。
Consider the function and evaluate this function at Since and the graph of is the graph of shifted left 3 units. Similarly, the graph of is the graph of shifted right units (Figure 1.24).
関数を考え、での値を求める。かつなので、のグラフはのグラフを左に3だけ平行移動したものになる。同様に、のグラフはのグラフを右にだけ移したものである(図1.24)。
OpenStax, Rice University; Calculus Volume 1. · CC BY-NC-SA 4.0
Figure 1.24図 1.24
(a) For the graph of is a horizontal shift left units of the graph of (b) For the graph of is a horizontal shift right units of the graph of
(a) のとき、のグラフはのグラフを左にだけ平行移動したものである。(b) のとき、のグラフはのグラフを右にだけ平行移動したものである。
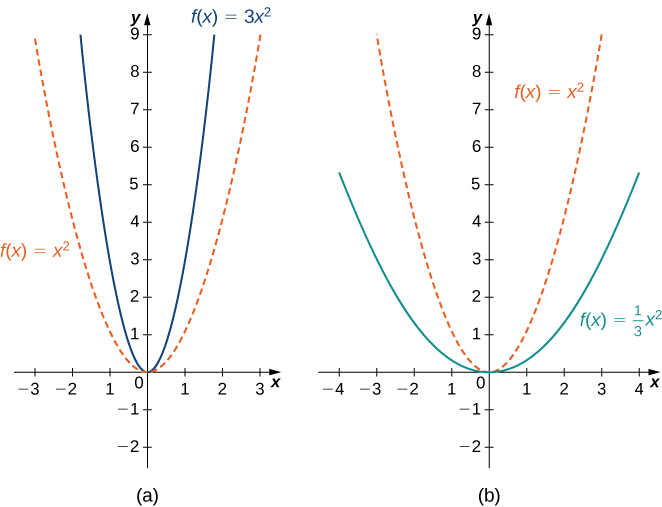
A vertical scaling of a graph occurs if we multiply all outputs of a function by the same positive constant. For the graph of the function is the graph of scaled vertically by a factor of If the values of the outputs for the function are larger than the values of the outputs for the function therefore, the graph has been stretched vertically. If then the outputs of the function are smaller, so the graph has been compressed. For example, the graph of the function is the graph of stretched vertically by a factor of 3, whereas the graph of is the graph of compressed vertically by a factor of (Figure 1.25).
英語のヒント
関数の出力すべてに同じ正の定数を掛けると、グラフは垂直方向に拡大・縮小される。のとき、のグラフはのグラフの縦座標を倍したものである。なら、の出力はの出力より絶対値が大きくなり、グラフは垂直方向に引き伸ばされる。なら、の出力の絶対値は小さくなり、グラフは圧縮される。たとえば、のグラフはを垂直方向に3倍に伸ばしたもの、のグラフはを垂直方向に分の1に縮めたものである(図1.25)。
OpenStax, Rice University; Calculus Volume 1. · CC BY-NC-SA 4.0
Figure 1.25図 1.25
(a) If the graph of is a vertical stretch of the graph of (b) If the graph of is a vertical compression of the graph of
(a) なら、のグラフはのグラフを垂直方向に伸ばしたものである。(b) なら、のグラフはのグラフを垂直方向に縮めたものである。
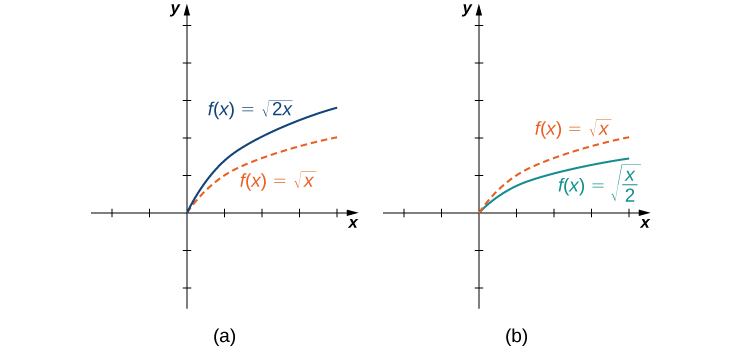
The horizontal scaling of a function occurs if we multiply the inputs by the same positive constant. For the graph of the function is the graph of scaled horizontally by a factor of If the graph of is the graph of compressed horizontally. If the graph of is the graph of stretched horizontally. For example, consider the function and evaluate at Since the graph of is the graph of compressed horizontally. The graph of is a horizontal stretch of the graph of (Figure 1.26).
関数の入力に同じ正の定数を掛けると、グラフは水平方向に拡大・縮小される。のとき、のグラフはのグラフの横座標を分の1倍したものである。なら、のグラフはのグラフを水平方向に縮めたものになる。なら、のグラフはのグラフを水平方向に伸ばしたものになる。たとえば関数を考え、におけるの値を求めよう。なので、のグラフはのグラフを水平方向に縮めたものになる。一方、のグラフはのグラフを水平方向に伸ばしたものである(図1.26)。
OpenStax, Rice University; Calculus Volume 1. · CC BY-NC-SA 4.0
Figure 1.26図 1.26
(a) If the graph of is a horizontal compression of the graph of (b) If the graph of is a horizontal stretch of the graph of
(a) なら、のグラフはのグラフを水平方向に縮めたものである。(b) なら、のグラフはのグラフを水平方向に伸ばしたものである。
We have explored what happens to the graph of a function when we multiply by a constant to get a new function We have also discussed what happens to the graph of a function when we multiply the independent variable by to get a new function However, we have not addressed what happens to the graph of the function if the constant is negative. If we have a constant we can write c as a positive number multiplied by but, what kind of transformation do we get when we multiply the function or its argument by When we multiply all the outputs by we get a reflection about the -axis. When we multiply all inputs by we get a reflection about the -axis. For example, the graph of is the graph of reflected about the -axis. The graph of is the graph of reflected about the -axis (Figure 1.27).
英語のヒント
関数に対し、に定数を掛けて新しい関数を作るとグラフがどう変わるかを調べた。また、関数の独立変数にを掛けて新しい関数を作った場合も調べた。しかし、定数が負の場合はまだ扱っていない。なら、cは正の数にを掛けたものとして書ける。では、関数そのもの、あるいは引数にを掛けると、どのような変換になるだろうか。出力すべてにを掛けると、軸についての対称移動となる。入力すべてにを掛けると、軸についての対称移動となる。たとえば、のグラフはのグラフを軸について反転したもの、のグラフはのグラフを軸について反転したものである(図1.27)。
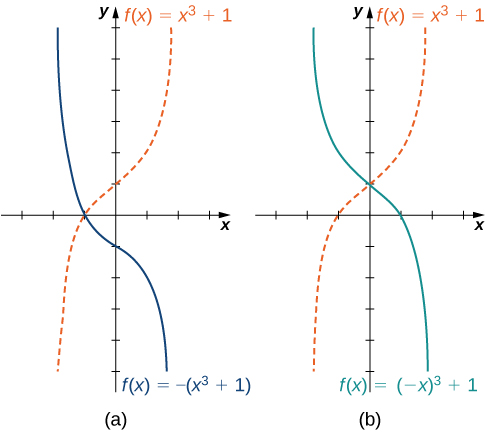
OpenStax, Rice University; Calculus Volume 1. · CC BY-NC-SA 4.0
Figure 1.27図 1.27
(a) The graph of is the graph of reflected about the -axis. (b) The graph of is the graph of reflected about the
-axis.
-axis.
(a) のグラフはのグラフを軸について反転したものである。(b) のグラフはのグラフを軸について反転したものである。
If the graph of a function consists of more than one transformation of another graph, it is important to transform the graph in the correct order. Given a function the graph of the related function can be obtained from the graph of by performing the transformations in the following order.
英語のヒント
別のグラフに複数の変換を施して関数のグラフを作るときは、変換の順序が重要である。関数が与えられると、関連する関数のグラフは、のグラフに次の順番で変換を施して得られる。
- Horizontal scaling of the graph of by a factor of If reflect the graph about the -axis.のグラフの横座標を倍する。なら、さらに軸について反転する。
- Horizontal shift of the graph of If shift left. If shift right.のグラフを水平方向に平行移動する。なら左へb、なら右へ|b|だけ移す。
- Vertical scaling of the graph of by a factor of If reflect the graph about the -axis.のグラフを垂直方向に倍する。なら、さらに軸について反転する。
- Vertical shift of the graph of If shift up. If shift down.のグラフを垂直方向に平行移動する。なら上へd、なら下へ|d|だけ移す。
We can summarize the different transformations and their related effects on the graph of a function in the following table.
各変換が関数のグラフに与える効果を、次の表にまとめる。
Transformation of の変換 |
Effect on the graph of のグラフへの効果 |
|---|---|
Vertical shift up units 上にだけ平行移動 |
|
Vertical shift down units 下にだけ平行移動 |
|
Shift left by units 左にだけ平行移動 |
|
Shift right by units 右にだけ平行移動 |
|
Vertical stretch if vertical compression if なら垂直方向に拡大、なら垂直方向に縮小 |
|
Horizontal stretch if horizontal compression if なら水平方向に拡大、なら水平方向に縮小 |
|
Reflection about the -axis 軸について対称移動 |
|
Reflection about the -axis 軸について対称移動 |
Example 1.21例題 1.21
Transforming a Function関数を変換する
For each of the following functions, a. and b., sketch a graph by using a sequence of transformations of a well-known function.
次の関数a、bについて、よく知っている関数に一連の変換を施し、グラフを描け。
Solution解き方
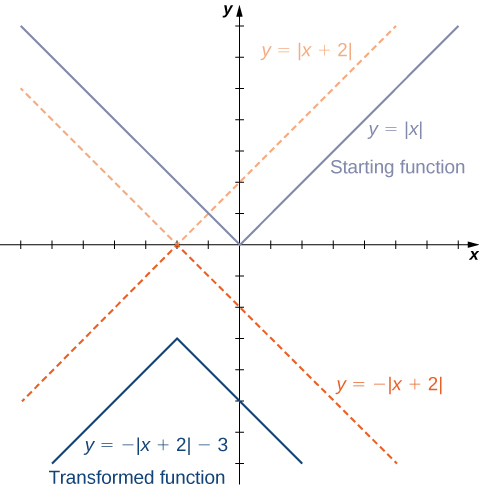
- Starting with the graph of shift units to the left, reflect about the -axis, and then shift down 3 units.のグラフから始め、左にだけ移し、軸について反転し、最後に下に3だけ移す。
OpenStax, Rice University; Calculus Volume 1. · CC BY-NC-SA 4.0
Figure 1.28図 1.28The function can be viewed as a sequence of three transformations of the function関数は、関数に3つの変換を順に施したものと考えられる。 - Starting with the graph of reflect about the -axis, stretch the graph vertically by a factor of 3, and move up 1 unit.のグラフから始め、軸について反転し、垂直方向に3倍に伸ばし、上へ1だけ移す。
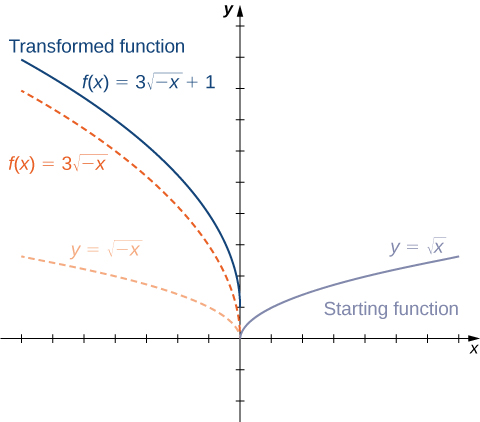
OpenStax, Rice University; Calculus Volume 1. · CC BY-NC-SA 4.0
Figure 1.29図 1.29The function can be viewed as a sequence of three transformations of the function関数は、関数に3つの変換を順に施したものと考えられる。