第1章関数とグラフ
Representing Functions関数を表す方法
Typically, a function is represented using one or more of the following tools:
関数は通常、次の方法を1つ、または複数使って表す。
- A table表
- A graphグラフ
- A formula式
We can identify a function in each form, but we can also use them together. For instance, we can plot on a graph the values from a table or create a table from a formula.
いずれの形式からも関数を読み取れるが、これらを組み合わせてもよい。たとえば、表の値をグラフ上に打つことも、式から表を作ることもできる。
Tables表
Functions described using a table of values arise frequently in real-world applications. Consider the following simple example. We can describe temperature on a given day as a function of time of day. Suppose we record the temperature every hour for a 24-hour period starting at midnight. We let our input variable be the time after midnight, measured in hours, and the output variable be the temperature hours after midnight, measured in degrees Fahrenheit. We record our data in Table 1.1.
英語のヒント
実際の応用では、値の表で記述された関数がよく現れる。簡単な例を考えよう。ある1日の気温は、その日の時刻の関数として記述できる。午前0時から24時間にわたって、1時間ごとに気温を記録するとしよう。入力変数を午前0時からの経過時間(単位:時間)、出力変数を午前0時から時間後の気温(単位:華氏)とする。このデータを表1.1に記録する。
Hours after Midnight 午前0時からの経過時間 |
Temperature 気温 |
Hours after Midnight 午前0時からの経過時間 |
Temperature 気温 |
|---|---|---|---|
0 |
58 |
12 |
84 |
1 |
54 |
13 |
85 |
2 |
53 |
14 |
85 |
3 |
52 |
15 |
83 |
4 |
52 |
16 |
82 |
5 |
55 |
17 |
80 |
6 |
60 |
18 |
77 |
7 |
64 |
19 |
74 |
8 |
72 |
20 |
69 |
9 |
75 |
21 |
65 |
10 |
78 |
22 |
60 |
11 |
80 |
23 |
58 |
We can see from the table that temperature is a function of time, and the temperature decreases, then increases, and then decreases again. However, we cannot get a clear picture of the behavior of the function without graphing it.
英語のヒント
表から、気温は時刻の関数であり、いったん下がってから上がり、その後また下がることがわかる。しかし、グラフを描かなければ、この関数の振る舞いをはっきりと捉えることはできない。
Graphsグラフ
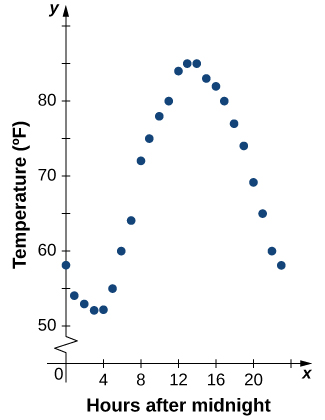
Given a function described by a table, we can provide a visual picture of the function in the form of a graph. Graphing the temperatures listed in Table 1.1 can give us a better idea of their fluctuation throughout the day. Figure 1.6 shows the plot of the temperature function.
英語のヒント
OpenStax, Rice University; Calculus Volume 1. · CC BY-NC-SA 4.0
Figure 1.6図 1.6
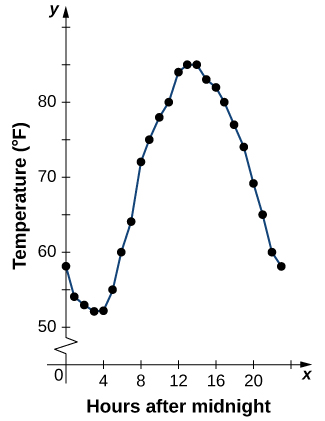
From the points plotted on the graph in Figure 1.6, we can visualize the general shape of the graph. It is often useful to connect the dots in the graph, which represent the data from the table. In this example, although we cannot make any definitive conclusion regarding what the temperature was at any time for which the temperature was not recorded, given the number of data points collected and the pattern in these points, it is reasonable to suspect that the temperatures at other times followed a similar pattern, as we can see in Figure 1.7.
英語のヒント
OpenStax, Rice University; Calculus Volume 1. · CC BY-NC-SA 4.0
Figure 1.7図 1.7
Connecting the dots in Figure 1.6 shows the general pattern of the data.
図1.6の点を結ぶと、データの全体的な変化の様子がわかる。
Algebraic Formulas代数式
Sometimes we are not given the values of a function in table form, rather we are given the values in an explicit formula. Formulas arise in many applications. For example, the area of a circle of radius is given by the formula When an object is thrown upward from the ground with an initial velocity ft/s, its height above the ground from the time it is thrown until it hits the ground is given by the formula When dollars are invested in an account at an annual interest rate compounded continuously, the amount of money after years is given by the formula Algebraic formulas are important tools to calculate function values. Often we also represent these functions visually in graph form.
英語のヒント
関数の値が表ではなく、具体的な式として与えられる場合もある。式は多くの応用場面に現れる。たとえば、半径の円の面積は、式で与えられる。物体を地面から初速度 ft/sで上向きに投げると、投げた瞬間から地面に戻るまでの高さは、式で与えられる。ドルを年利率で連続複利の口座に預けた場合、年後の金額は式で与えられる。代数式は、関数の値を計算するための重要な道具である。また、その関数をグラフとして視覚的に表すことも多い。
Given an algebraic formula for a function the graph of is the set of points where is in the domain of and is in the range. To graph a function given by a formula, it is helpful to begin by using the formula to create a table of inputs and outputs. If the domain of consists of an infinite number of values, we cannot list all of them, but because listing some of the inputs and outputs can be very useful, it is often a good way to begin.
関数を表す代数式が与えられたとき、のグラフは、がの定義域に属し、が値域に属するような点の集合である。式で与えられた関数のグラフを描くには、まずその式を使って入力と出力の表を作るとよい。の定義域が無限個の値からなる場合、すべてを書き並べることはできない。それでも、いくつかの入力と出力を並べるだけで大いに役立つため、手始めとしてよい方法になることが多い。
When creating a table of inputs and outputs, we typically check to determine whether zero is an output. Those values of where are called the zeros of a function. For example, the zeros of are The zeros determine where the graph of intersects the -axis, which gives us more information about the shape of the graph of the function. The graph of a function may never intersect the x-axis, or it may intersect multiple (or even infinitely many) times.
英語のヒント
入力と出力の表を作るときには、通常、出力が0になるかどうかを調べる。を満たすの値を、関数の零点という。たとえば、の零点はである。零点は、のグラフと軸が交わる場所を決め、グラフの形を知る手がかりになる。関数のグラフがx軸とまったく交わらないこともあれば、複数回、さらには無限回交わることもある。
Another point of interest is the -intercept, if it exists. The -intercept is given by
英語のヒント
もう1つ注目したいのは、存在する場合の軸との交点である。軸との交点はで与えられる。
Since a function has exactly one output for each input, the graph of a function can have, at most, one -intercept. If is in the domain of a function then has exactly one -intercept. If is not in the domain of then has no -intercept. Similarly, for any real number if is in the domain of there is exactly one output and the line intersects the graph of exactly once. On the other hand, if is not in the domain of is not defined and the line does not intersect the graph of This property is summarized in the vertical line test.
英語のヒント
関数では1つの入力に対して出力がちょうど1つなので、グラフと軸との交点は多くても1つである。が関数の定義域に含まれるなら、には軸との交点がちょうど1つある。がの定義域に含まれなければ、には軸との交点がない。同様に、任意の実数について、がの定義域に含まれるなら、出力がちょうど1つ存在し、直線はのグラフとちょうど1回交わる。これに対して、が定義域に含まれない場合、は定義されず、直線はのグラフと交わらない。この性質をまとめたものが、鉛直線判定法である。
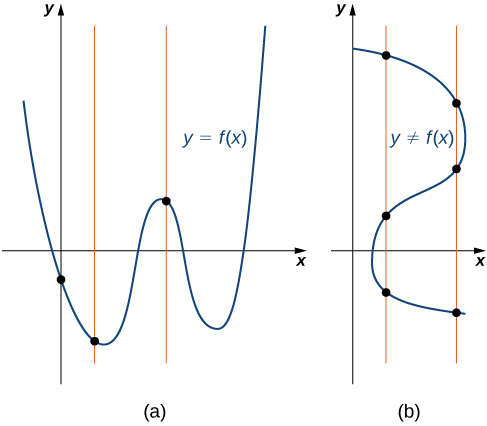
We can use this test to determine whether a set of plotted points represents the graph of a function (Figure 1.8).
この判定法により、打たれた点の集合が関数のグラフを表しているかどうかを調べられる(図1.8)。
OpenStax, Rice University; Calculus Volume 1. · CC BY-NC-SA 4.0
Figure 1.8図 1.8
(a) The set of plotted points represents the graph of a function because every vertical line intersects the set of points, at most, once. (b) The set of plotted points does not represent the graph of a function because some vertical lines intersect the set of points more than once.
(a) どの鉛直線も点の集合と多くて1回しか交わらないので、この点の集合は関数のグラフを表す。(b) 点の集合と2回以上交わる鉛直線があるので、この点の集合は関数のグラフを表さない。
Example 1.3例題 1.3
Finding Zeros and -Intercepts of a Function関数の零点と軸との交点を求める
Consider the function
関数を考えよ。
- Find all zeros ofの零点をすべて求めよ。
- Find the -intercept (if any).軸との交点を求めよ(存在する場合)。
- Sketch a graph ofのグラフの概形を描け。
Solution解き方
- To find the zeros, solve We discover that has one zero at零点を求めるには、を解く。はに零点を1つ持つことがわかる。
- The -intercept is given by軸との交点はである。
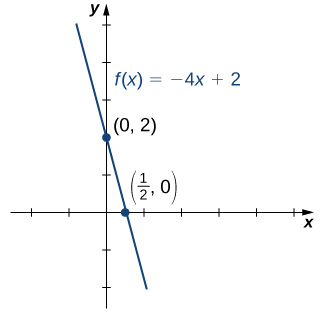
- Given that is a linear function of the form that passes through the points and we can sketch the graph of (Figure 1.9).はの形の1次関数で、点とを通る。そのため、のグラフの概形を描ける(図1.9)。
OpenStax, Rice University; Calculus Volume 1. · CC BY-NC-SA 4.0
Figure 1.9図 1.9The function is a line with
-intercept and -intercept関数のグラフは直線であり、軸との交点は、軸との交点はである。
Example 1.4例題 1.4
Using Zeros and -Intercepts to Sketch a Graph零点と軸との交点を使ってグラフの概形を描く
Consider the function
関数を考えよ。
- Find all zeros ofの零点をすべて求めよ。
- Find the -intercept (if any).軸との交点を求めよ(存在する場合)。
- Sketch a graph ofのグラフの概形を描け。
Solution解き方
- To find the zeros, solve This equation implies Since for all this equation has no solutions, and therefore has no zeros.零点を求めるには、を解く。この式からとなる。定義域内のすべてのについてなので、この方程式に解はなく、に零点はない。
- The -intercept is given by軸との交点はである。
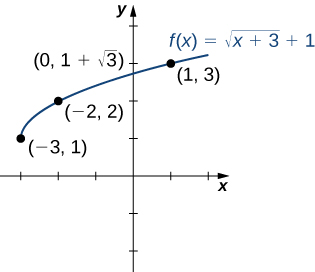
- To graph this function, we make a table of values. Since we need we need to choose values of We choose values that make the square-root function easy to evaluate.この関数のグラフを描くために、値の表を作る。でなければならないので、の値を選ぶ必要がある。平方根の値を計算しやすくなるように、値を選ぼう。Table 1.2表 1.2
Making use of the table and knowing that, since the function is a square root, the graph of should be similar to the graph of we sketch the graph (Figure 1.10).
表を使い、この関数が平方根を用いた関数であることから、のグラフはのグラフに似た形になると考えて、概形を描く(図1.10)。
OpenStax, Rice University; Calculus Volume 1. · CC BY-NC-SA 4.0
Figure 1.10図 1.10
The graph of has a
-intercept but no -intercepts.
-intercept but no -intercepts.
のグラフには軸との交点があるが、軸との交点はない。
Example 1.5例題 1.5
Finding the Height of a Free-Falling Object自由落下する物体の高さを求める
If a ball is dropped from a height of ft, its height at time is given by the function where is measured in feet and is measured in seconds. The domain is restricted to the interval where is the time when the ball is dropped and is the time when the ball hits the ground.
英語のヒント
ボールを高さ ftから落とすと、時刻での高さは関数で与えられる。の単位はフィート、の単位は秒である。定義域は区間に制限する。はボールを落とした時刻、は地面に着く時刻である。
- Create a table showing the height when Using the data from the table, determine the domain for this function. That is, find the time when the ball hits the ground.における高さを示す表を作れ。そのデータを使って、この関数の定義域を求めよ。すなわち、ボールが地面に着く時刻を求めよ。
- Sketch a graph ofのグラフの概形を描け。
Solution解き方
Height as a Function of Time 時刻の関数としての高さ
Table 1.3表 1.3Since the ball hits the ground when the domain of this function is the intervalボールが地面に着くのはのときなので、この関数の定義域は区間である。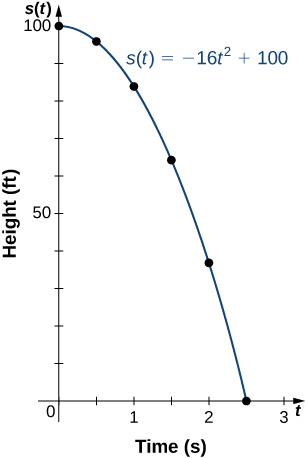
OpenStax, Rice University; Calculus Volume 1. · CC BY-NC-SA 4.0
Note that for this function and the function graphed in Figure 1.9, the values of are getting smaller as is getting larger. A function with this property is said to be decreasing. On the other hand, for the function graphed in Figure 1.10, the values of are getting larger as the values of are getting larger. A function with this property is said to be increasing. It is important to note, however, that a function can be increasing on some interval or intervals and decreasing over a different interval or intervals. For example, using our temperature function in Figure 1.6, we can see that the function is decreasing on the interval increasing on the interval and then decreasing on the interval We make the idea of a function increasing or decreasing over a particular interval more precise in the next definition.
英語のヒント
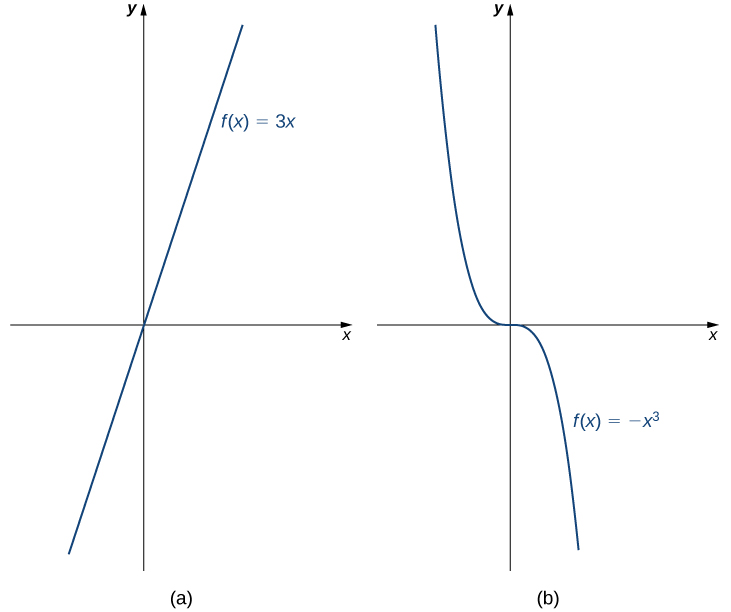
For example, the function is increasing on the interval because whenever On the other hand, the function is strictly decreasing on the interval because whenever (Figure 1.11).
英語のヒント
たとえば、関数は区間で増加する。であれば常にだからである。一方、関数は区間で狭義単調減少する。であれば常にだからである(図1.11)。
OpenStax, Rice University; Calculus Volume 1. · CC BY-NC-SA 4.0
Figure 1.11図 1.11
(a) The function is increasing on the interval (b) The function is decreasing on the interval
(a) 関数は区間で増加する。(b) 関数は区間で減少する。