第10章液体と固体
10.4 Phase Diagrams10.4 相図
Learning Objectives学習目標
By the end of this section, you will be able to:
この節を学ぶと、次のことができるようになる。
- Explain the construction and use of a typical phase diagram代表的な相図の構成と使い方を説明する。
- Use phase diagrams to identify stable phases at given temperatures and pressures, and to describe phase transitions resulting from changes in these properties相図を使って、指定された温度と圧力で安定な相を特定し、温度や圧力の変化による相転移を説明する。
- Describe the supercritical fluid phase of matter物質の超臨界流体相を説明する。
In the previous module, the variation of a liquid’s equilibrium vapor pressure with temperature was described. Considering the definition of boiling point, plots of vapor pressure versus temperature represent how the boiling point of the liquid varies with pressure. Also described was the use of heating and cooling curves to determine a substance’s melting (or freezing) point. Making such measurements over a wide range of pressures yields data that may be presented graphically as a phase diagram. A phase diagram combines plots of pressure versus temperature for the liquid-gas, solid-liquid, and solid-gas phase-transition equilibria of a substance. These diagrams indicate the physical states that exist under specific conditions of pressure and temperature, and also provide the pressure dependence of the phase-transition temperatures (melting points, sublimation points, boiling points). A typical phase diagram for a pure substance is shown in Figure 10.31.
英語のヒント
前の節では、液体の平衡蒸気圧が温度によってどう変わるかを説明した。沸点の定義を考えると、温度に対して蒸気圧を描いたグラフは、液体の沸点が圧力によってどう変わるかを表す。また、加熱曲線と冷却曲線を使って、物質の融点または凝固点を求める方法も説明した。これらを広い圧力範囲で測定すると、相図というグラフに表せるデータが得られる。相図は、液体−気体、固体−液体、固体−気体の各相転移平衡について、圧力と温度のグラフを組み合わせたものである。これにより、特定の圧力と温度でどの物理的状態が存在するかがわかり、融点、昇華点、沸点という相転移温度の圧力依存性もわかる。純物質の典型的な相図を図10.31に示す。
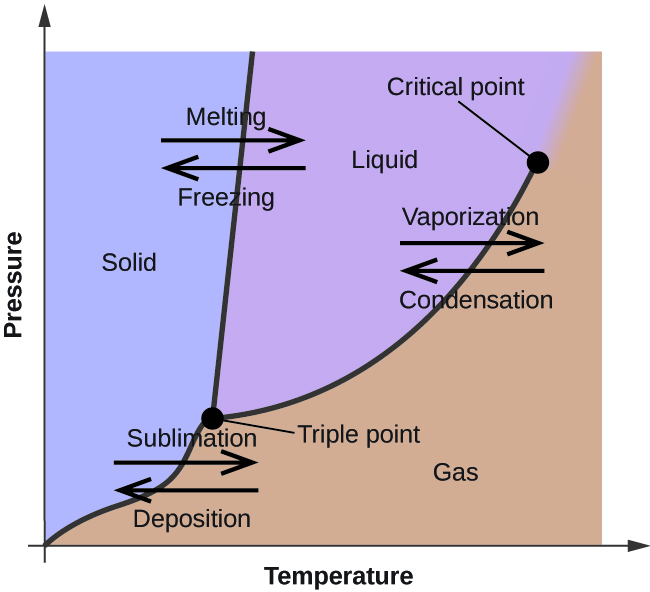
Figure 10.31図 10.31
The physical state of a substance and its phase-transition temperatures are represented graphically in a phase diagram.
物質の物理的状態と相転移温度は、相図によってグラフで表される。
To illustrate the utility of these plots, consider the phase diagram for water shown in Figure 10.32.
英語のヒント
相図の有用性を示すため、図10.32の水の相図を考えよう。
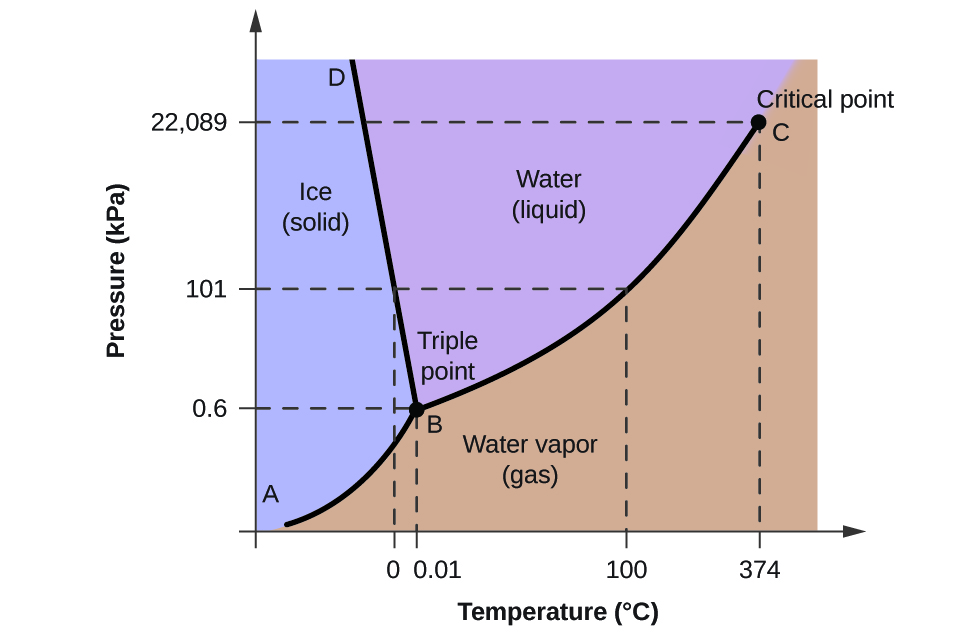
Figure 10.32図 10.32
The pressure and temperature axes on this phase diagram of water are not drawn to constant scale in order to illustrate several important properties.
この水の相図では、いくつかの重要な性質を示すために、圧力軸と温度軸は一定の縮尺では描かれていない。
We can use the phase diagram to identify the physical state of a sample of water under specified conditions of pressure and temperature. For example, a pressure of 50 kPa and a temperature of −10 °C correspond to the region of the diagram labeled “ice.” Under these conditions, water exists only as a solid (ice). A pressure of 50 kPa and a temperature of 50 °C correspond to the “water” region—here, water exists only as a liquid. At 25 kPa and 200 °C, water exists only in the gaseous state. Note that on the H2O phase diagram, the pressure and temperature axes are not drawn to a constant scale in order to permit the illustration of several important features as described here.
相図を使うと、指定された圧力と温度で水がどの物理的状態にあるかを見分けられる。例えば、50 kPa、−10 °Cは「氷」と表示された領域に対応し、水は固体の氷としてのみ存在する。50 kPa、50 °Cは「水」の領域にあたり、液体としてのみ存在する。25 kPa、200 °Cでは、気体としてのみ存在する。ここで説明する重要な特徴をいくつか図示できるように、このH2Oの相図の圧力軸と温度軸は一定の縮尺にしていないことに注意しよう。
The curve BC in Figure 10.32 is the plot of vapor pressure versus temperature as described in the previous module of this chapter. This “liquid-vapor” curve separates the liquid and gaseous regions of the phase diagram and provides the boiling point for water at any pressure. For example, at 1 atm, the boiling point is 100 °C. Notice that the liquid-vapor curve terminates at a temperature of 374 °C and a pressure of 218 atm, indicating that water cannot exist as a liquid above this temperature, regardless of the pressure. The physical properties of water under these conditions are intermediate between those of its liquid and gaseous phases. This unique state of matter is called a supercritical fluid, a topic that will be described in the next section of this module.
英語のヒント
図10.32の曲線BCは、前の節で述べた、温度に対する蒸気圧のグラフである。この液体−蒸気曲線は、相図の液体領域と気体領域を分け、任意の圧力での水の沸点を示す。例えば、1 atmでは沸点は100 °Cである。液体−蒸気曲線が374 °C、218 atmで終わることに注目しよう。これは、この温度を超えると、どのような圧力でも水は液体として存在できないことを示す。この条件における水の物理的性質は、液相と気相の中間になる。この独特な物質の状態を超臨界流体といい、この節の次の項目で説明する。
The solid-vapor curve, labeled AB in Figure 10.32, indicates the temperatures and pressures at which ice and water vapor are in equilibrium. These temperature-pressure data pairs correspond to the sublimation, or deposition, points for water. If we could zoom in on the solid-gas line in Figure 10.32, we would see that ice has a vapor pressure of about 0.20 kPa at −10 °C. Thus, if we place a frozen sample in a vacuum with a pressure less than 0.20 kPa, ice will sublime. This is the basis for the “freeze-drying” process often used to preserve foods, such as the ice cream shown in Figure 10.33.
英語のヒント
Image omitted because its reuse rights could not be verified.権利の確認ができないため画像を割愛。
Figure 10.33図 10.33
Freeze-dried foods, like this ice cream, are dehydrated by sublimation at pressures below the triple point for water. (credit: ʺlwaoʺ/Flickr)
このアイスクリームのような凍結乾燥食品は、水の三重点より低い圧力で、昇華によって水分を除去する。(クレジット:「lwao」/Flickr)
The solid-liquid curve labeled BD shows the temperatures and pressures at which ice and liquid water are in equilibrium, representing the melting/freezing points for water. Note that this curve exhibits a slight negative slope (greatly exaggerated for clarity), indicating that the melting point for water decreases slightly as pressure increases. Water is an unusual substance in this regard, as most substances exhibit an increase in melting point with increasing pressure. This behavior is partly responsible for the movement of glaciers, like the one shown in Figure 10.34. The bottom of a glacier experiences an immense pressure due to its weight that can melt some of the ice, forming a layer of liquid water on which the glacier may more easily slide.
英語のヒント
BDという固体−液体曲線は、氷と液体の水が平衡になる温度と圧力、すなわち水の融点・凝固点を表す。この曲線の傾きがわずかに負である(見やすくするため大きく誇張している)ことは、圧力が増すと水の融点が少し下がることを示す。大部分の物質では圧力とともに融点が上がるので、水はこの点で例外的な物質である。この振る舞いは、図10.34のような氷河が移動する原因の一部となっている。氷河の底では、その重さによる莫大な圧力で氷の一部が融け、水の層が生じるため、その上を氷河が滑りやすくなる。
Image omitted because its reuse rights could not be verified.権利の確認ができないため画像を割愛。
Figure 10.34図 10.34
The immense pressures beneath glaciers result in partial melting to produce a layer of water that provides lubrication to assist glacial movement. This satellite photograph shows the advancing edge of the Perito Moreno glacier in Argentina. (credit: NASA)
氷河の下の莫大な圧力は氷の一部を融かし、水の層を作る。この層が潤滑の役割を果たし、氷河の移動を助ける。この衛星写真は、アルゼンチンのペリト・モレノ氷河の前進する先端を示す。(クレジット:NASA)
The point of intersection of all three curves is labeled B in Figure 10.32. At the pressure and temperature represented by this point, three phases of water coexist in equilibrium. This temperature-pressure data pair is called the triple point. At pressures lower than the triple point, water cannot exist as a liquid, regardless of the temperature.
英語のヒント
三つの曲線が交わる点は、図10.32のBである。この点が示す圧力と温度では、水の三つの相が平衡を保って共存する。この温度と圧力の組を三重点という。三重点より低い圧力では、温度にかかわらず、水は液体として存在できない。
Example 10.11例題 10.11
Determining the State of Water水の状態を判定する
Using the phase diagram for water given in Figure 10.32, determine the state of water at the following temperatures and pressures:
図10.32の水の相図を用いて、次の温度と圧力での水の状態を求めなさい。
(a) −10 °C and 50 kPa
(a) −10 °C、50 kPa
(b) 25 °C and 90 kPa
(b) 25 °C、90 kPa
(c) 50 °C and 40 kPa
(c) 50 °C、40 kPa
(d) 80 °C and 5 kPa
(d) 80 °C、5 kPa
(e) −10 °C and 0.3 kPa
(e) −10 °C、0.3 kPa
(f) 50 °C and 0.3 kPa
(f) 50 °C、0.3 kPa
Solution解法
Using the phase diagram for water, we can determine that the state of water at each temperature and pressure given are as follows: (a) solid; (b) liquid; (c) liquid; (d) gas; (e) solid; (f) gas.
水の相図より、与えられた各温度と圧力での状態は、(a) 固体、(b) 液体、(c) 液体、(d) 気体、(e) 固体、(f) 気体とわかる。
Check Your Learning理解度の確認
What phase changes can water undergo as the temperature changes if the pressure is held at 0.3 kPa? If the pressure is held at 50 kPa?
圧力を0.3 kPaに保って温度を変えると、水はどのような相変化を起こしうるか。50 kPaに保った場合はどうか。
Consider the phase diagram for carbon dioxide shown in Figure 10.35 as another example. The solid-liquid curve exhibits a positive slope, indicating that the melting point for CO2 increases with pressure as it does for most substances (water being a notable exception as described previously). Notice that the triple point is well above 1 atm, indicating that carbon dioxide cannot exist as a liquid under ambient pressure conditions. Instead, cooling gaseous carbon dioxide at 1 atm results in its deposition into the solid state. Likewise, solid carbon dioxide does not melt at 1 atm pressure but instead sublimes to yield gaseous CO2. Finally, notice that the critical point for carbon dioxide is observed at a relatively modest temperature and pressure in comparison to water.
英語のヒント
別の例として、図10.35の二酸化炭素の相図を考えよう。固体−液体曲線の傾きは正であり、大部分の物質と同様、CO2の融点は圧力とともに上がることを示している(前述のように、水は注目すべき例外である)。三重点は1 atmをかなり上回り、通常の周囲の圧力では二酸化炭素が液体として存在できないことがわかる。代わりに、1 atmで二酸化炭素気体を冷やすと、凝華して固体になる。同様に、固体二酸化炭素は1 atmでは融けず、昇華して気体CO2になる。最後に、二酸化炭素の臨界点は、水と比べて比較的低い温度と圧力で見られることに注目しよう。
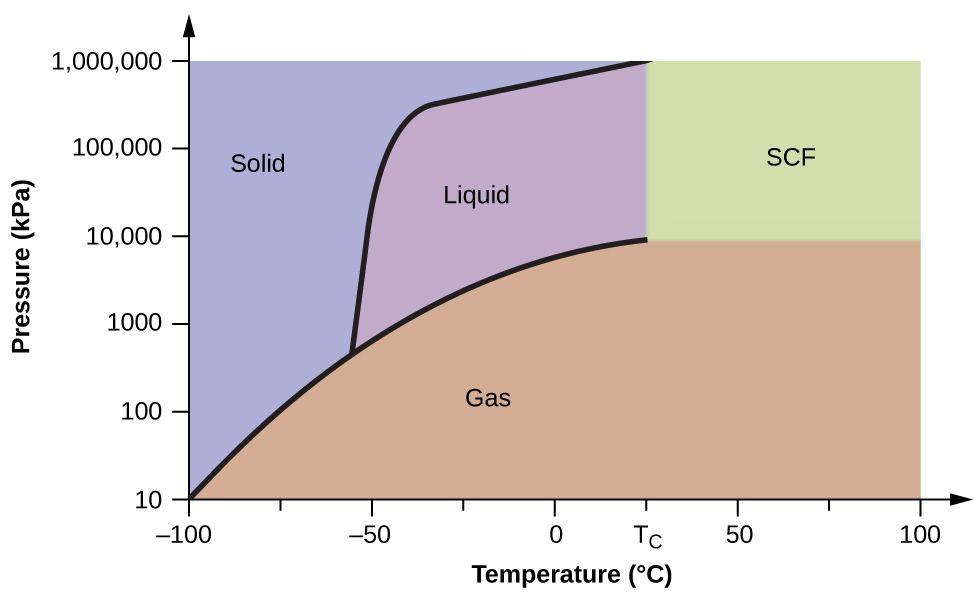


Figure 10.35図 10.35
A phase diagram for carbon dioxide is shown. The pressure axis is plotted on a logarithmic scale to accommodate the large range of values.
英語のヒント
二酸化炭素の相図。広い値の範囲を収めるため、圧力軸には対数目盛を用いている。
Example 10.12例題 10.12
Determining the State of Carbon Dioxide二酸化炭素の状態を判定する
Using the phase diagram for carbon dioxide shown in Figure 10.35, determine the state of CO2 at the following temperatures and pressures:
図10.35の二酸化炭素の相図を用いて、次の温度と圧力でのCO2の状態を求めなさい。
(a) −30 °C and 2000 kPa
(a) −30 °C、2000 kPa
(b) −90 °C and 1000 kPa
(b) −90 °C、1000 kPa
(c) −60 °C and 100 kPa
(c) −60 °C、100 kPa
(d) −40 °C and 1500 kPa
(d) −40 °C、1500 kPa
(e) 0 °C and 100 kPa
(e) 0 °C、100 kPa
(f) 20 °C and 100 kPa
(f) 20 °C、100 kPa
Solution解法
Using the phase diagram for carbon dioxide provided, we can determine that the state of CO2 at each temperature and pressure given are as follows: (a) liquid; (b) solid; (c) gas; (d) liquid; (e) gas; (f) gas.
示された二酸化炭素の相図から、それぞれの温度と圧力でのCO2の状態は次のように求められる。(a) 液体、(b) 固体、(c) 気体、(d) 液体、(e) 気体、(f) 気体。
Check Your Learning理解を確かめよう
Identify the phase changes that carbon dioxide will undergo as its temperature is increased from −100 °C while holding its pressure constant at 1500 kPa. At 50 kPa. At what approximate temperatures do these phase changes occur?
英語のヒント
二酸化炭素の圧力を1500 kPaに保ち、温度を−100 °Cから上げると、どのような相変化が起こるか。50 kPaに保った場合はどうか。これらの相変化はおよそ何°Cで起こるか。