第4章離散確率変数
Notation for the Hypergeometric: H = Hypergeometric Probability Distribution Function超幾何分布の表記:H = 超幾何確率分布関数
X ~ H(r, b, n)
Read this as "X is a random variable with a hypergeometric distribution." The parameters are r, b, and n; r = the size of the group of interest (first group), b = the size of the second group, n = the size of the chosen sample.
これを「Xは超幾何分布に従う確率変数である」と読む。母数はr、b、nで、r = 関心のある集団(第1群)の大きさ、b = 第2群の大きさ、n = 選ぶ標本の大きさである。
Example 4.25例題 4.25
A school site committee is to be chosen randomly from six men and five women. If the committee consists of four members chosen randomly, what is the probability that two of them are men? How many men do you expect to be on the committee?
男性6人と女性5人から、学校の委員会を無作為に選ぶ。委員会が無作為に選ばれた4人からなる場合、そのうち2人が男性である確率はいくらか。委員会の男性は何人と予想されるか。
Let X = the number of men on the committee of four. The men are the group of interest (first group).
X = 4人の委員会に入る男性の人数とする。男性が関心のある集団(第1群)である。
X takes on the values 0, 1, 2, 3, 4, where r = 6, b = 5, and n = 4. X ~ H(6, 5, 4)
Xは0、1、2、3、4の値を取り、r = 6、b = 5、n = 4である。X ~ H(6, 5, 4)
Find P(x = 2). P(x = 2) = 0.4545 (calculator or computer)
P(x = 2)を求める。P(x = 2) = 0.4545となる(電卓またはコンピューターによる)。
The probability that there are two men on the committee is about 0.45.
委員会に男性が2人いる確率は約0.45である。
The graph of X ~ H(6, 5, 4) is:
X ~ H(6, 5, 4)のグラフは次のようになる。
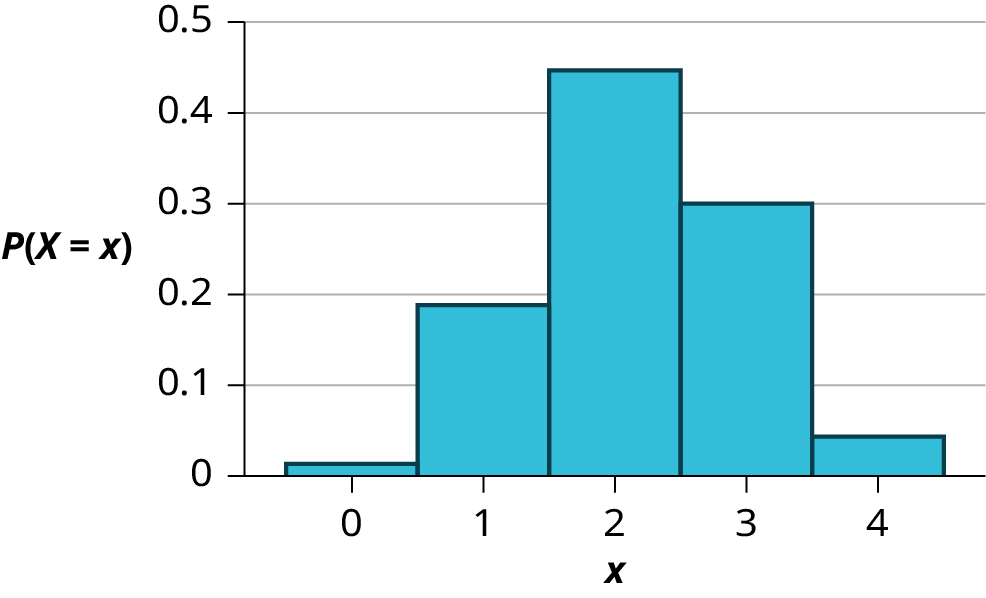

Figure 4.6図 4.6
The y-axis contains the probability of X, where X = the number of men on the committee.
y軸はXの確率を表す。ここでX = 委員会の男性の人数である。
You would expect m = 2.18 (about two) men on the committee.
委員会の男性はm = 2.18人(約2人)と予想される。
The formula for the mean is
平均の公式はである。
Chapter Review章の復習
A hypergeometric experiment is a statistical experiment with the following properties:
超幾何実験は、次の性質をもつ統計的実験である。
- You take samples from two groups.二つの集団から標本を取り出す。
- You are concerned with a group of interest, called the first group.関心の対象となる集団を第1の集団と呼ぶ。
- You sample without replacement from the combined groups.二つの集団を合わせたものから非復元抽出する。
- Each pick is not independent, since sampling is without replacement.非復元抽出なので、各抽出は独立ではない。
- You are not dealing with Bernoulli Trials.ベルヌーイ試行を扱っているわけではない。
The outcomes of a hypergeometric experiment fit a hypergeometric probability distribution. The random variable X = the number of items from the group of interest. The distribution of X is denoted X ~ H(r, b, n), where r = the size of the group of interest (first group), b = the size of the second group, and n = the size of the chosen sample. It follows that
n ≤ r + b. The mean of X is μ = and the standard deviation is σ = .
n ≤ r + b. The mean of X is μ = and the standard deviation is σ = .
超幾何実験の結果は超幾何確率分布に従う。確率変数X = 関心のある集団から選ばれた要素の個数である。Xの分布をX ~ H(r, b, n)と表す。r = 関心のある集団(第1群)の大きさ、b = 第2群の大きさ、n = 選ぶ標本の大きさである。したがって、n ≤ r + bとなる。Xの平均はμ = 、標準偏差はσ = である。
Formula Review公式の復習
X ~ H(r, b, n) means that the discrete random variable X has a hypergeometric probability distribution with r = the size of the group of interest (first group), b = the size of the second group, and n = the size of the chosen sample.
X ~ H(r, b, n)は、離散確率変数Xが超幾何確率分布に従うことを意味する。r = 関心のある集団(第1群)の大きさ、b = 第2群の大きさ、n = 選ぶ標本の大きさである。
X = the number of items from the group of interest that are in the chosen sample, and X may take on the values x = 0, 1, ..., up to the size of the group of interest. (The minimum value for X may be larger than zero in some instances.)
X = 選んだ標本に含まれる、関心のある集団の要素の個数である。Xはx = 0, 1, …から、関心のある集団の大きさまでの値を取りうる(場合によっては、Xの最小値が0より大きくなる)。
n ≤ r + b
The mean of X is given by the formula μ = and the standard deviation is = .
Xの平均はμ = 、標準偏差は = で与えられる。
Exercises 94–98練習問題 94–98
Use the following information to answer the next five exercises: Suppose that a group of statistics students is divided into two groups: business majors and non-business majors. There are 16 business majors in the group and seven non-business majors in the group. A random sample of nine students is taken. We are interested in the number of business majors in the sample.
次の情報を使って、続く5問に答えよ。統計学の学生を、経営学専攻者とそれ以外の専攻者の二群に分けるとする。経営学専攻者は16人、それ以外は7人いる。9人の無作為標本を取る。標本に含まれる経営学専攻者の人数に関心がある。
Exercise 94問題 94
In words, define the random variable X.
確率変数Xを言葉で定義せよ。
Solution解き方
X = the number of business majors in the sample.
X = 標本中の経営学専攻者の人数。
Exercise 95問題 95
X ~ _____(_____,_____)
Exercise 96問題 96
What values does X take on?
Xはどのような値をとるか。
Solution解き方
2, 3, 4, 5, 6, 7, 8, 9
Exercise 97問題 97
Find the standard deviation.
標準偏差を求めよ。
Exercise 98問題 98
On average (μ), how many would you expect to be business majors?
平均して(μ)、何人が経営学専攻者であると予想されるか。
Solution解き方
6.26