第4章離散確率変数
Exercises 66–79練習問題 66–79
Let X = the number of games won in that upcoming month.
X = その月に勝つ試合の数とする。
Exercise 66問題 66
What is the probability that the San Jose Sharks win six games in that upcoming month?
サンノゼ・シャークスがその月に6勝する確率はいくらか。
- 0.1476
- 0.2336
- 0.7664
- 0.8903
Exercise 67問題 67
What is the probability that the San Jose Sharks win at least five games in that upcoming month
サンノゼ・シャークスがその月に少なくとも5勝する確率はいくらか。
- 0.3694
- 0.5266
- 0.4734
- 0.2305
Solution解き方
c
Exercise 68問題 68
A student takes a ten-question true-false quiz, but did not study and randomly guesses each answer. Find the probability that the student passes the quiz with a grade of at least 70% of the questions correct.
ある学生が10問の正誤式小テストを受けるが、勉強しておらず、各問の答えを無作為に推測する。70%以上の問題に正解して合格する確率を求めよ。
Exercise 69問題 69
A student takes a 32-question multiple-choice exam, but did not study and randomly guesses each answer. Each question has three possible choices for the answer. Find the probability that the student guesses more than 75% of the questions correctly.
ある学生が32問の多肢選択式試験を受けるが、勉強しておらず、各問の答えを無作為に推測する。各問の選択肢は三つである。75%より多くの問題に正解する確率を求めよ。
Solution解き方
- X = number of questions answered correctlyX = 正解した問題数
- X ~ B
- We are interested in MORE THAN 75% of 32 questions correct. 75% of 32 is 24. We want to find P(x > 24). The event "more than 24" is the complement of "less than or equal to 24."関心があるのは32問の75%より多く正解することである。32の75%は24なので、P(x > 24)を求めたい。「24より多い」という事象は、「24以下」の余事象である。
- Using your calculator's distribution menu: 1 – binomcdf電卓の分布メニューを使う:1 − binomcdf
- P(x > 24) = 0
- The probability of getting more than 75% of the 32 questions correct when randomly guessing is very small and practically zero.無作為に推測して32問の75%より多く正解する確率は、非常に小さく、事実上0である。
Exercise 70問題 70
Six different colored dice are rolled. Of interest is the number of dice that show a one.
色の異なるサイコロを6個投げる。関心があるのは、1の目が出るサイコロの個数である。
- In words, define the random variable X.確率変数Xを言葉で定義せよ。
- List the values that X may take on.Xがとりうる値を列挙せよ。
- Give the distribution of X. X ~ _____(_____,_____)Xの分布を示せ。X ~ _____(_____,_____)
- On average, how many dice would you expect to show a one?平均して、何個のサイコロで1の目が出ると予想されるか。
- Find the probability that all six dice show a one.6個すべてが1の目になる確率を求めよ。
- Is it more likely that three or that four dice will show a one? Use numbers to justify your answer numerically.1の目が出るサイコロが3個の場合と4個の場合では、どちらの可能性が高いか。数値で根拠を示せ。
Exercise 71問題 71
More than 96 percent of the very largest colleges and universities (more than 15,000 total enrollments) have some online offerings. Suppose you randomly pick 13 such institutions. We are interested in the number that offer distance learning courses.
英語のヒント
最大規模の大学(在籍者総数15,000人超)の96%超が、何らかのオンライン授業を提供している。そのような大学を13校無作為に選ぶとする。遠隔授業を提供する大学の数に関心がある。
- In words, define the random variable X.確率変数Xを言葉で定義せよ。
- List the values that X may take on.Xがとりうる値を列挙せよ。
- Give the distribution of X. X ~ _____(_____,_____)Xの分布を示せ。X ~ _____(_____,_____)
- On average, how many schools would you expect to offer such courses?平均して、そのような授業を提供する大学は何校と予想されるか。
- Find the probability that at most ten offer such courses.そのような授業を提供する大学が10校以下である確率を求めよ。
- Is it more likely that 12 or that 13 will offer such courses? Use numbers to justify your answer numerically and answer in a complete sentence.そのような授業を提供する大学が12校の場合と13校の場合では、どちらの可能性が高いか。数値で根拠を示し、完全な文で答えよ。
Solution解き方
- X = the number of college and universities that offer online offerings.X = オンライン授業を提供する大学の数。
- 0, 1, 2, …, 13
- X ~ B(13, 0.96)
- 12.48
- 0.0135
- P(x = 12) = 0.3186 P(x = 13) = 0.5882 More likely to get 13.P(x = 12) = 0.3186、P(x = 13) = 0.5882。13校の可能性のほうが高い。
Exercise 72問題 72
Suppose that about 85% of graduating students attend their graduation. A group of 22 graduating students is randomly chosen.
卒業生の約85%が卒業式に出席するとする。卒業生22人を無作為に選ぶ。
- In words, define the random variable X.確率変数Xを言葉で定義せよ。
- List the values that X may take on.Xがとりうる値を列挙せよ。
- Give the distribution of X. X ~ _____(_____,_____)Xの分布を示せ。X ~ _____(_____,_____)
- How many are expected to attend their graduation?何人が卒業式に出席すると予想されるか。
- Find the probability that 17 or 18 attend.17人または18人が出席する確率を求めよ。
- Based on numerical values, would you be surprised if all 22 attended graduation? Justify your answer numerically.数値に基づくと、22人全員が卒業式に出席したら驚くか。数値で根拠を示せ。
Exercise 73問題 73
At The Fencing Center, 60% of the fencers use the foil as their main weapon. We randomly survey 25 fencers at The Fencing Center. We are interested in the number of fencers who do not use the foil as their main weapon.
英語のヒント
The Fencing Centerでは、選手の60%が主な武器としてフルーレを使っている。同センターの選手25人を無作為に調査する。主な武器としてフルーレを使わない選手の人数に関心がある。
- In words, define the random variable X.確率変数Xを言葉で定義せよ。
- List the values that X may take on.Xがとりうる値を列挙せよ。
- Give the distribution of X. X ~ _____(_____,_____)Xの分布を示せ。X ~ _____(_____,_____)
- How many are expected to not to use the foil as their main weapon?主な武器としてフルーレを使わない選手は何人と予想されるか。
- Find the probability that six do not use the foil as their main weapon.主な武器としてフルーレを使わない選手が6人である確率を求めよ。
- Based on numerical values, would you be surprised if all 25 did not use foil as their main weapon? Justify your answer numerically.数値に基づくと、25人全員が主な武器としてフルーレを使わなかったら驚くか。数値で根拠を示せ。
Solution解き方
- X = the number of fencers who do not use the foil as their main weaponX = 主な武器としてフルーレを使わない選手の人数
- 0, 1, 2, 3,... 25
- X ~ B(25,0.40)
- 10
- 0.0442
- The probability that all 25 not use the foil is almost zero. Therefore, it would be very surprising.25人全員がフルーレを使わない確率はほぼ0なので、非常に驚くべきことである。
Exercise 74問題 74
Approximately 8% of students at a local high school participate in after-school sports all four years of high school. A group of 60 seniors is randomly chosen. Of interest is the number who participated in after-school sports all four years of high school.
ある地元の高校では、生徒の約8%が高校の4年間すべてで放課後のスポーツ活動に参加する。最上級生60人を無作為に選ぶ。4年間すべて参加した人数に関心がある。
- In words, define the random variable X.確率変数Xを言葉で定義せよ。
- List the values that X may take on.Xがとりうる値を列挙せよ。
- Give the distribution of X. X ~ _____(_____,_____)Xの分布を示せ。X ~ _____(_____,_____)
- How many seniors are expected to have participated in after-school sports all four years of high school?高校の4年間すべてで放課後のスポーツ活動に参加した最上級生は、何人と予想されるか。
- Based on numerical values, would you be surprised if none of the seniors participated in after-school sports all four years of high school? Justify your answer numerically.数値に基づくと、4年間すべて放課後のスポーツ活動に参加した最上級生が1人もいなかったら驚くか。数値で根拠を示せ。
- Based upon numerical values, is it more likely that four or that five of the seniors participated in after-school sports all four years of high school? Justify your answer numerically.数値に基づくと、4年間すべて放課後のスポーツ活動に参加した最上級生が4人の場合と5人の場合では、どちらの可能性が高いか。数値で根拠を示せ。
Exercise 75問題 75
The chance of an IRS audit for a tax return with over $25,000 in income is about 2% per year. We are interested in the expected number of audits a person with that income has in a 20-year period. Assume each year is independent.
英語のヒント
所得が25,000ドルを超える申告書が米国内国歳入庁(IRS)の税務調査を受ける確率は、年間約2%である。この所得の人が20年間に受ける調査回数の期待値に関心がある。各年は独立していると仮定する。
- In words, define the random variable X.確率変数Xを言葉で定義せよ。
- List the values that X may take on.Xがとりうる値を列挙せよ。
- Give the distribution of X. X ~ _____(_____,_____)Xの分布を示せ。X ~ _____(_____,_____)
- How many audits are expected in a 20-year period?20年間に何回の税務調査が予想されるか。
- Find the probability that a person is not audited at all.一度も税務調査を受けない確率を求めよ。
- Find the probability that a person is audited more than twice.税務調査を2回より多く受ける確率を求めよ。
Solution解き方
- X = the number of audits in a 20-year periodX = 20年間の税務調査の回数
- 0, 1, 2, …, 20
- X ~ B(20, 0.02)
- 0.4
- 0.6676
- 0.0071
Exercise 76問題 76
It has been estimated that only about 30% of California residents have adequate earthquake supplies. Suppose you randomly survey 11 California residents. We are interested in the number who have adequate earthquake supplies.
英語のヒント
十分な地震用備蓄をもつカリフォルニア州民は、約30%にすぎないと推定されている。州民11人を無作為に調査するとする。十分な地震用備蓄をもつ人数に関心がある。
- In words, define the random variable X.確率変数Xを言葉で定義せよ。
- List the values that X may take on.Xがとりうる値を列挙せよ。
- Give the distribution of X. X ~ _____(_____,_____)Xの分布を示せ。X ~ _____(_____,_____)
- What is the probability that at least eight have adequate earthquake supplies?少なくとも8人が十分な地震用備蓄をもつ確率はいくらか。
- Is it more likely that none or that all of the residents surveyed will have adequate earthquake supplies? Why?調査した全員が十分な地震用備蓄をもたない場合と、全員がもつ場合では、どちらの可能性が高いか。理由も述べよ。
- How many residents do you expect will have adequate earthquake supplies?十分な地震用備蓄をもつ住民は何人と予想されるか。
Exercise 77問題 77
There are two similar games played for Chinese New Year and Vietnamese New Year. In the Chinese version, fair dice with numbers 1, 2, 3, 4, 5, and 6 are used, along with a board with those numbers. In the Vietnamese version, fair dice with pictures of a gourd, fish, rooster, crab, crayfish, and deer are used. The board has those six objects on it, also. We will play with bets being $1. The player places a bet on a number or object. The “house” rolls three dice. If none of the dice show the number or object that was bet, the house keeps the $1 bet. If one of the dice shows the number or object bet (and the other two do not show it), the player gets back their $1 bet, plus $1 profit. If two of the dice show the number or object bet (and the third die does not show it), the player gets back their $1 bet, plus $2 profit. If all three dice show the number or object bet, the player gets back their $1 bet, plus $3 profit. Let X = number of matches and Y = profit per game.
英語のヒント
中国の正月とベトナムの正月には、よく似た二つのゲームがある。中国版では1、2、3、4、5、6の目をもつ公平なサイコロと、その数字を記した盤を使う。ベトナム版では、ひょうたん、魚、雄鶏、カニ、ザリガニ、シカの絵が付いた公平なサイコロを使う。盤にも同じ六つの絵がある。賭け金を1ドルとして遊ぶ。プレイヤーが一つの数字または絵に賭け、胴元がサイコロを3個投げる。賭けた数字や絵が一つも出なければ、胴元が1ドルを受け取る。1個だけに出れば、プレイヤーは賭け金1ドルを取り戻し、さらに1ドルの利益を得る。2個に出て残る1個には出なければ、賭け金1ドルに加えて2ドルの利益を得る。3個すべてに出れば、賭け金1ドルに加えて3ドルの利益を得る。X = 一致する個数、Y = 1回のゲームの利益とする。
- In words, define the random variable X.確率変数Xを言葉で定義せよ。
- List the values that X may take on.Xがとりうる値を列挙せよ。
- Give the distribution of X. X ~ _____(_____,_____)Xの分布を示せ。X ~ _____(_____,_____)
- List the values that Y may take on. Then, construct one PDF table that includes both X and Y and their probabilities.Yが取りうる値を列挙せよ。次に、XとYおよびそれぞれの確率を含むPDF表を一つ作成せよ。
- Calculate the average expected matches over the long run of playing this game for the player.プレイヤーがこのゲームを長期にわたって行う場合、一致する個数の期待値を計算せよ。
- Calculate the average expected earnings over the long run of playing this game for the player.プレイヤーがこのゲームを長期にわたって行う場合、平均収益の期待値を計算せよ。
- Determine who has the advantage, the player or the house.プレイヤーと胴元のどちらが有利かを判断せよ。
Solution解き方
- X = the number of matchesX = 一致する個数
- 0, 1, 2, 3
- X ~ B
- In dollars: −1, 1, 2, 3ドル単位で、−1、1、2、3。
- Multiply each Y value by the corresponding X probability from the PDF table. The answer is −0.0787. You lose about eight cents, on average, per game.各Yの値に、PDF表の対応するXの確率を掛ける。答えは−0.0787となる。1回当たり平均約8セント失う。
- The house has the advantage.胴元のほうが有利である。
Exercise 78問題 78
Only 9% of the population of Niger has access to the internet. Suppose we randomly sample 150 people in Niger. Let X = the number of people who have access to the internet.
ニジェールの人口のうち、インターネットを利用できるのは9%にすぎない。ニジェールの人150人を無作為に抽出するとする。X = インターネットを利用できる人の人数とする。
- What is the probability distribution for X?Xの確率分布は何か。
- Using the formulas, calculate the mean and standard deviation of X.公式を使ってXの平均と標準偏差を計算せよ。
- Use your calculator to find the probability that 15 people in the sample have access to the internet.電卓を使って、標本中の15人がインターネットを利用できる確率を求めよ。
- Find the probability that at most ten people in the sample have access to the internet.標本中でインターネットを利用できる人が10人以下である確率を求めよ。
- Find the probability that more than 25 people in the sample have access to the internet.標本中でインターネットを利用できる人が25人より多い確率を求めよ。
Exercise 79問題 79
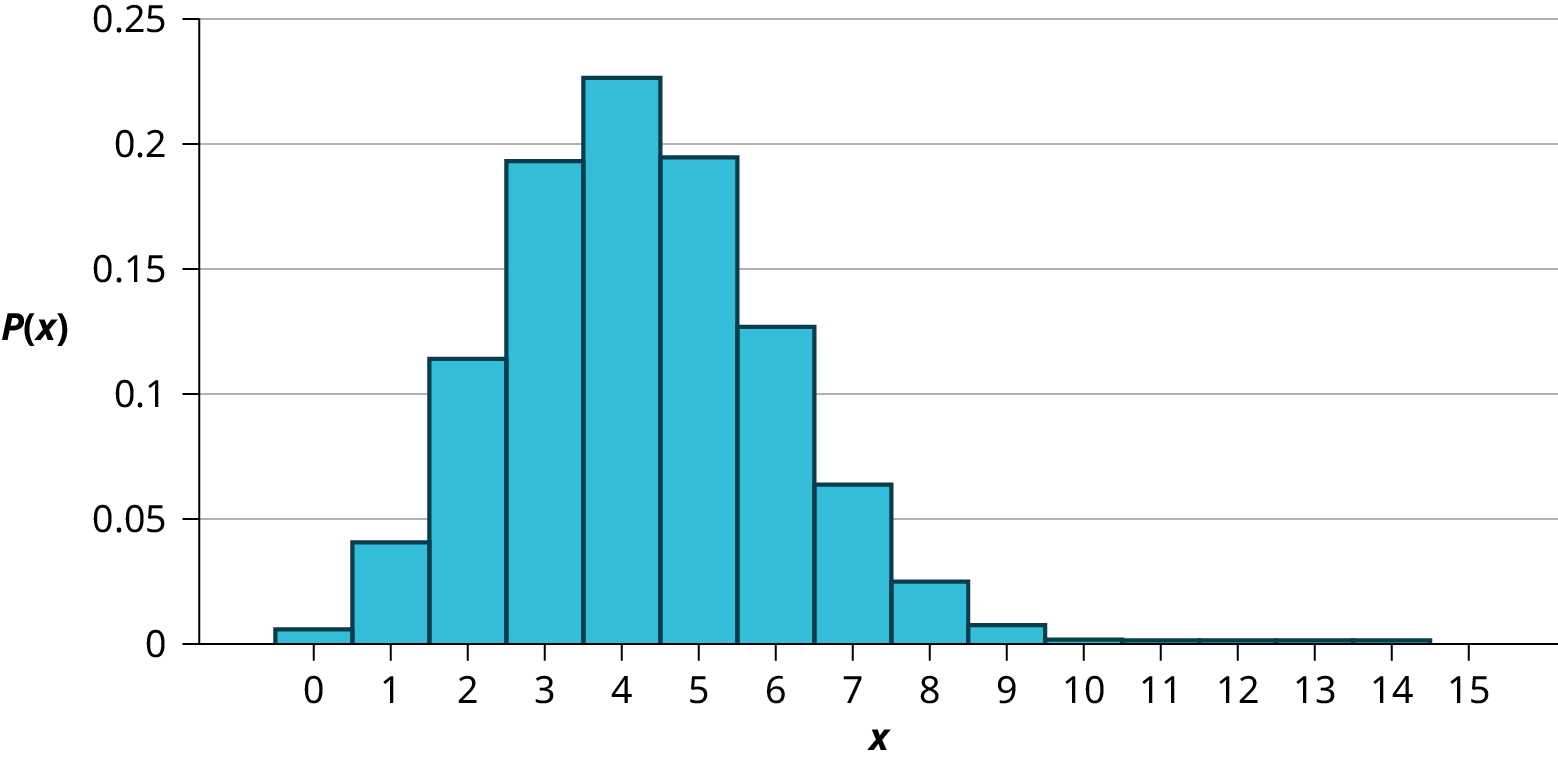
The literacy rate for a nation measures the proportion of people age 15 and over that can read and write. The literacy rate in a certain country is 28.1%. Suppose you choose 15 people in that country at random. Let X = the number of people who are literate.
英語のヒント
国の識字率は、15歳以上の人のうち読み書きができる人の割合を測る。ある国の識字率は28.1%である。その国の人15人を無作為に選ぶとする。X = 読み書きのできる人の人数とする。
- Sketch a graph of the probability distribution of X.Xの確率分布のグラフを概略で描け。
- Using the formulas, calculate the (i) mean and (ii) standard deviation of X.公式を使い、Xの(i)平均と(ii)標準偏差を計算せよ。
- Find the probability that more than five people in the sample are literate. Is it is more likely that three people or four people are literate.標本中で読み書きのできる人が5人より多い確率を求めよ。読み書きのできる人が3人の場合と4人の場合では、どちらの可能性が高いか。
Solution解き方
- X ~ B(15, 0.281)Figure 4.4図 4.4
- Mean = μ = np = 15(0.281) = 4.215平均 = μ = np = 15(0.281) = 4.215
- Standard Deviation = σ = = = 1.7409標準偏差 = σ = = = 1.7409
- P(x > 5) = 1 – P(x ≤ 5) = 1 – binomcdf(15, 0.281, 5) = 1 – 0.7754 = 0.2246
P(x = 3) = binompdf(15, 0.281, 3) = 0.1927
P(x = 4) = binompdf(15, 0.281, 4) = 0.2259
It is more likely that four people are literate that three people are.P(x > 5) = 1 − P(x ≤ 5) = 1 − binomcdf(15, 0.281, 5) = 1 − 0.7754 = 0.2246。P(x = 3) = binompdf(15, 0.281, 3) = 0.1927。P(x = 4) = binompdf(15, 0.281, 4) = 0.2259。読み書きのできる人が3人より4人である可能性のほうが高い。

Binomial Experiment
二項実験
a statistical experiment that satisfies the following three conditions:
次の三つの条件を満たす統計的実験。
- There are a fixed number of trials, n.試行回数nが固定されている。
- There are only two possible outcomes, called "success" and, "failure," for each trial. The letter p denotes the probability of a success on one trial, and q denotes the probability of a failure on one trial.各試行の結果は「成功」と「失敗」の二通りだけである。1回の試行の成功確率をp、失敗確率をqで表す。
- The n trials are independent and are repeated using identical conditions.n回の試行は独立で、同じ条件の下で繰り返される。
Bernoulli Trials
ベルヌーイ試行
an experiment with the following characteristics:
次の特徴をもつ実験。
- There are only two possible outcomes called “success” and “failure” for each trial.各試行の結果は「成功」と「失敗」の二通りだけである。
- The probability p of a success is the same for any trial (so the probability q = 1 − p of a failure is the same for any trial).どの試行でも成功確率pは同じである(したがって、失敗確率q = 1 − pもどの試行でも同じである)。
Binomial Probability Distribution
二項確率分布
a discrete random variable (RV) that arises from Bernoulli trials; there are a fixed number, n, of independent trials. “Independent” means that the result of any trial (for example, trial one) does not affect the results of the following trials, and all trials are conducted under the same conditions. Under these circumstances the binomial RV X is defined as the number of successes in n trials. The notation is: X ~ B(n, p). The mean is μ = np and the standard deviation is σ = . The probability of exactly x successes in n trials is
P(X = x) = pxqn − x.
P(X = x) = pxqn − x.
ベルヌーイ試行から生じる離散確率変数(RV)。独立な試行の回数nは固定されている。「独立」とは、ある試行(たとえば1回目)の結果が、その後の試行の結果に影響しないことを意味し、すべての試行は同じ条件で行われる。この状況では、二項確率変数Xをn回の試行での成功回数と定義する。X ~ B(n, p)と表記する。平均はμ = np、標準偏差はσ = である。n回の試行でちょうどx回成功する確率は、P(X = x) = pxqn − xである。