第4章離散確率変数
Notation for the Binomial: B = Binomial Probability Distribution Function二項分布の表記:B = 二項確率分布関数
X ~ B(n, p)
Read this as "X is a random variable with a binomial distribution." The parameters are n and p; n = number of trials, p = probability of a success on each trial.
これを「Xは二項分布に従う確率変数である」と読む。母数はnとpで、n = 試行回数、p = 各試行での成功確率である。
Example 4.13例題 4.13
It has been stated that about 41% of adult workers have a high school diploma but do not pursue any further education. If 20 adult workers are randomly selected, find the probability that at most 12 of them have a high school diploma but do not pursue any further education. How many adult workers do you expect to have a high school diploma but do not pursue any further education?
英語のヒント
働く成人の約41%は高校卒業資格をもち、それ以上の教育を受けていないとされる。働く成人を20人無作為に選ぶとき、高校卒業後にそれ以上の教育を受けていない人が12人以下である確率を求めよ。そのような成人は何人いると予想されるか。
Let X = the number of workers who have a high school diploma but do not pursue any further education.
X = 高校卒業資格をもち、それ以上の教育を受けていない労働者の人数とする。
X takes on the values 0, 1, 2, ..., 20 where n = 20, p = 0.41, and q = 1 – 0.41 = 0.59. X ~ B(20, 0.41)
Xは0、1、2、…、20の値を取り、n = 20、p = 0.41、q = 1 − 0.41 = 0.59である。X ~ B(20, 0.41)
Find P(x ≤ 12). P(x ≤ 12) = 0.9738. (calculator or computer)
P(x ≤ 12)を求める。P(x ≤ 12) = 0.9738となる(電卓またはコンピューターによる)。
Using the Calculator電卓の操作
The probability that at most 12 workers have a high school diploma but do not pursue any further education is 0.9738.
高校卒業資格をもち、それ以上の教育を受けていない労働者が12人以下である確率は0.9738である。
The graph of X ~ B(20, 0.41) is as follows:
X ~ B(20, 0.41)のグラフは次のようになる。
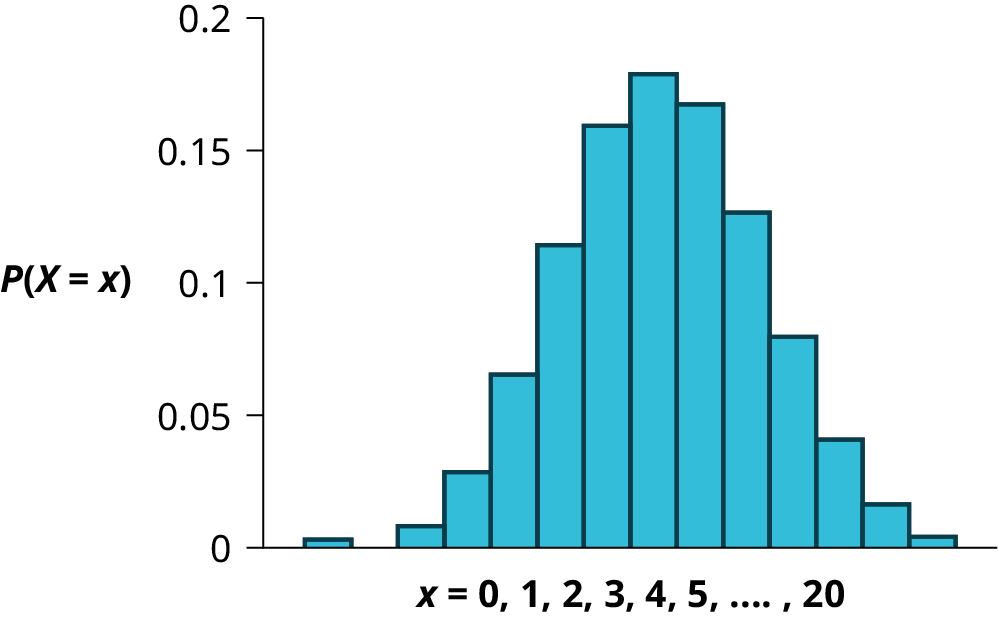

Figure 4.3図 4.3
The y-axis contains the probability of x, where X = the number of workers who have only a high school diploma.
y軸はxの確率を表す。ここでX = 高校卒業資格だけをもつ労働者の人数である。
The number of adult workers that you expect to have a high school diploma but not pursue any further education is the mean, μ = np = (20)(0.41) = 8.2.
高校卒業資格をもち、それ以上の教育を受けていないと予想される成人労働者の人数は、平均μ = np = (20)(0.41) = 8.2である。
The formula for the variance is σ2 = npq. The standard deviation is σ = .
σ = = 2.20.
σ = = 2.20.
分散の公式はσ2 = npqである。標準偏差はσ = であり、σ = = 2.20となる。
Example 4.14例題 4.14
In the 2013 Jerry’s Artarama art supplies catalog, there are 560 pages. Eight of the pages feature signature artists. Suppose we randomly sample 100 pages. Let X = the number of pages that feature signature artists.
英語のヒント
2013年のJerry’s Artaramaの画材カタログは560ページある。そのうち8ページでは代表的なアーティストを特集している。100ページを無作為に抽出するとする。X = 代表的なアーティストを特集するページ数とする。
- What values does x take on?xはどのような値を取るか。
- What is the probability distribution? Find the following probabilities:確率分布は何か。次の確率を求めよ。
- the probability that two pages feature signature artists2ページが代表的なアーティストを特集している確率。
- the probability that at most six pages feature signature artists代表的なアーティストを特集するページが6ページ以下である確率。
- the probability that more than three pages feature signature artists.代表的なアーティストを特集するページが3ページより多い確率。
- Using the formulas, calculate the (i) mean and (ii) standard deviation.公式を使って、(i)平均と(ii)標準偏差を計算せよ。
Solution解き方
- x = 0, 1, 2, 3, 4, 5, 6, 7, 8
- X ~ B
- P(x = 2) = binompdf = 0.2466
- P(x ≤ 6) = binomcdf = 0.9994
- P(x > 3) = 1 – P(x ≤ 3) = 1 – binomcdf = 1 – 0.9443 = 0.0557P(x > 3) = 1 − P(x ≤ 3) = 1 − binomcdf = 1 − 0.9443 = 0.0557
- Mean = np = (100) = ≈ 1.4286平均 = np = (100) = ≈ 1.4286
- Standard Deviation = = ≈ 1.1867標準偏差 = = ≈ 1.1867
Example 4.15例題 4.15
The lifetime risk of developing cancer is about one in 67 (1.5%). Suppose we randomly sample 200 people. Let X = the number of people who will develop cancer.
生涯にがんを発症するリスクは約67人に1人(1.5%)である。200人を無作為に抽出するとする。X = がんを発症する人の人数とする。
- What is the probability distribution for X?Xの確率分布は何か。
- Using the formulas, calculate the (i) mean and (ii) standard deviation of X.公式を使い、Xの(i)平均と(ii)標準偏差を計算せよ。
- Use your calculator to find the probability that at most eight people develop cancer電卓を使って、がんを発症する人が8人以下である確率を求めよ。
- Is it more likely that five or six people will develop cancer? Justify your answer numerically.がんを発症する人が5人の場合と6人の場合では、どちらの可能性が高いか。数値で根拠を示せ。
Solution解き方
- The probability that five people develop cancer is 0.1011. The probability that six people develop cancer is 0.0500.5人ががんを発症する確率は0.1011で、6人が発症する確率は0.0500である。
Example 4.16例題 4.16
The following example illustrates a problem that is not binomial. It violates the condition of independence. ABC College has a student advisory committee made up of ten staff members and six students. The committee wishes to choose a chairperson and a recorder. What is the probability that the chairperson and recorder are both students? The names of all committee members are put into a box, and two names are drawn without replacement. The first name drawn determines the chairperson and the second name the recorder. There are two trials. However, the trials are not independent because the outcome of the first trial affects the outcome of the second trial. The probability of a student on the first draw is . The probability of a student on the second draw is , when the first draw selects a student. The probability is , when the first draw selects a staff member. The probability of drawing a student's name changes for each of the trials and, therefore, violates the condition of independence.
英語のヒント
次の例は二項分布ではない問題を示す。独立性の条件を満たさないからである。ABCカレッジには職員10人と学生6人からなる学生諮問委員会がある。委員会は委員長と記録係を選びたいと考えている。両方とも学生となる確率はいくらか。全委員の名前を箱に入れ、戻さずに二つ引く。最初に引いた名前が委員長、2番目が記録係となる。試行は2回だが、1回目の結果が2回目に影響するため、独立ではない。1回目に学生を引く確率はである。1回目が学生なら、2回目に学生を引く確率はである。1回目が職員なら、確率はとなる。学生の名前を引く確率が試行ごとに変わるので、独立性の条件を満たさない。