第14章ストレス、生活習慣、健康
Good Stress?良いストレス?
Although stress carries a negative connotation, at times it may be of some benefit. Stress can motivate us to do things in our best interests, such as study for exams, visit the doctor regularly, exercise, and perform to the best of our ability at work. Indeed, Selye (1974) pointed out that not all stress is harmful. He argued that stress can sometimes be a positive, motivating force that can improve the quality of our lives. This kind of stress, which Selye called eustress (from the Greek eu = “good”), is a good kind of stress associated with positive feelings, optimal health, and performance. A moderate amount of stress can be beneficial in challenging situations. For example, athletes may be motivated and energized by pregame stress, and students may experience similar beneficial stress before a major exam. Indeed, research shows that moderate stress can enhance both immediate and delayed recall of educational material. Participants in one study who memorized a scientific text passage showed improved memory of the passage immediately after exposure to a mild stressor as well as one day following exposure to the stressor (Hupbach & Fieman, 2012).
英語のヒント
ストレスには否定的な含みがあるが、ときには何らかの役に立つこともある。ストレスは、試験勉強をする、定期的に医者にかかる、運動する、仕事で力を最大限に発揮するといった、自分のためになることをするよう私たちを動機づけうる。実際、セリエ(1974)は、すべてのストレスが有害なわけではないと指摘した。彼は、ストレスはときに、私たちの生活の質を高めうる、前向きで人を動機づける力になりうると論じた。セリエがユーストレス(ギリシャ語のeu=「良い」から)と呼んだこの種のストレスは、肯定的な感情や、最適な健康状態とパフォーマンスと関連した、良い種類のストレスである。適度な量のストレスは、困難な状況で有益になりうる。たとえば、運動選手は試合前のストレスによって動機づけられ、活力を得るかもしれないし、学生も大事な試験の前に同じような有益なストレスを経験するかもしれない。実際、適度なストレスが学習内容の直後再生と遅延再生の両方を高めうることが、研究で示されている。ある研究では、科学的な文章の一節を記憶した参加者は、軽いストレッサーにさらされた直後にも、ストレッサーにさらされてから1日後にも、その一節についての記憶が向上していた(Hupbach & Fieman, 2012)。
Increasing one’s level of stress will cause performance to change in a predictable way. As shown in Figure 14.4, as stress increases, so do performance and general well-being (eustress); when stress levels reach an optimal level (the highest point of the curve), performance reaches its peak. A person at this stress level is colloquially at the top of their game, meaning they feel fully energized, focused, and can work with minimal effort and maximum efficiency. But when stress exceeds this optimal level, it is no longer a positive force—it becomes excessive and debilitating, or what Selye termed distress (from the Latin dis = “bad”). People who reach this level of stress feel burned out; they are fatigued, exhausted, and their performance begins to decline. If the stress remains excessive, health may begin to erode as well (Everly & Lating, 2002). A good example of distress is severe test anxiety. When students are feeling very stressed about a test, negative emotions combined with physical symptoms may make concentration difficult, thereby negatively affecting test scores.
英語のヒント
ストレスの水準を上げていくと、パフォーマンスは予測可能なしかたで変化する。図14.4に示すように、ストレスが増えるにつれて、パフォーマンスと全般的な幸福も高まる(ユーストレス)。そして、ストレスの水準が最適な水準(曲線の最高点)に達すると、パフォーマンスはピークに達する。このストレス水準にある人は、くだけた言い方をすれば「絶好調」の状態にある。つまり、活力に満ちて集中しており、最小限の努力で最大限の効率を上げて働くことができる。しかし、ストレスがこの最適な水準を超えると、それはもはや前向きな力ではなくなる。過剰で人を消耗させるもの、すなわちセリエがディストレス(ラテン語のdis=「悪い」から)と名づけたものになるのである。このストレス水準に達した人は、燃え尽きたように感じる。疲れ果てて消耗し、パフォーマンスが低下しはじめる。ストレスが過剰なままだと、健康も損なわれはじめるかもしれない(Everly & Lating, 2002)。ディストレスのよい例は、重いテスト不安である。学生がテストのことで強いストレスを感じていると、否定的な感情が身体症状と重なって集中を難しくし、その結果、テストの得点に悪影響を及ぼすかもしれない。
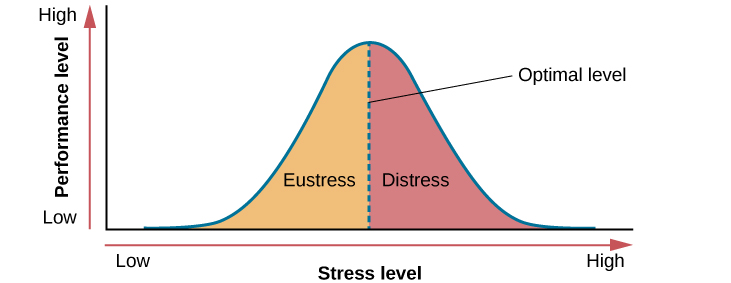
Figure 14.4図 14.4
As the stress level increases from low to moderate, so does performance (eustress). At the optimal level (the peak of the curve), performance has reached its peak. If stress exceeds the optimal level, it will reach the distress region, where it will become excessive and debilitating, and performance will decline (Everly & Lating, 2002).
ストレスの水準が低い状態から中程度へと高まるにつれて、パフォーマンスも高まる(ユーストレス)。最適な水準(曲線の頂点)では、パフォーマンスはピークに達している。ストレスが最適な水準を超えるとディストレスの領域に入り、そこではストレスが過剰で人を消耗させるものになって、パフォーマンスは低下する(Everly & Lating, 2002)。
The Prevalence of Stressストレスの広がり
Stress is everywhere and, as shown in Figure 14.5, it has been on the rise over the last several years. Each of us is acquainted with stress—some are more familiar than others. In many ways, stress feels like a load you just can’t carry—a feeling you experience when, for example, you have to drive somewhere in a blizzard, when you wake up late the morning of an important job interview, when you run out of money before the next pay period, and before taking an important exam for which you realize you are not fully prepared.
英語のヒント
ストレスはどこにでもあり、図14.5に示すように、ここ数年増加を続けている。私たちは誰でもストレスを知っているが、ほかの人よりもなじみの深い人もいる。多くの点で、ストレスは、とても背負いきれない重荷のように感じられる。それは、たとえば吹雪の中をどこかへ車で行かなければならないとき、大事な就職面接の日の朝に寝坊したとき、次の給料日の前にお金が尽きたとき、そして十分に準備できていないと自覚している大事な試験を受ける前に経験する感覚である。
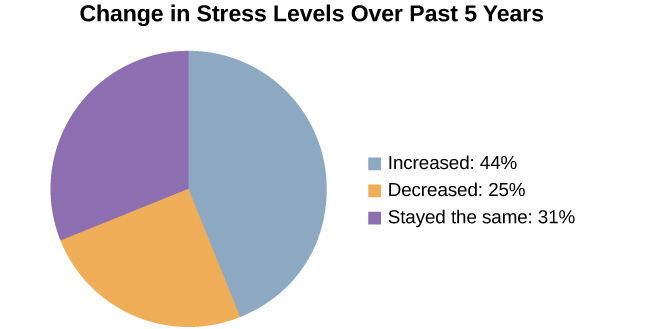
Figure 14.5図 14.5
Nearly half of U.S. adults indicated that their stress levels have increased over the last five years (Neelakantan, 2013).
アメリカの成人のほぼ半数が、自分のストレス水準がこの5年間で増えたと答えた(Neelakantan, 2013)。
Stress is an experience that evokes a variety of responses, including those that are physiological (e.g., accelerated heart rate, headaches, or gastrointestinal problems), cognitive (e.g., difficulty concentrating or making decisions), and behavioral (e.g., drinking alcohol, smoking, or taking actions directed at eliminating the cause of the stress). Although stress can be positive at times, it can have deleterious health implications, contributing to the onset and progression of a variety of physical illnesses and diseases (Cohen & Herbert, 1996).
英語のヒント
ストレスはさまざまな反応を呼び起こす経験である。その中には、生理的な反応(たとえば心拍数の上昇、頭痛、胃腸の不調)、認知的な反応(たとえば集中や意思決定の困難)、行動的な反応(たとえば飲酒、喫煙、ストレスの原因を取り除くことを目指した行動をとること)が含まれる。ストレスはときに前向きなものでありうるが、健康に有害な影響を及ぼすこともあり、さまざまな身体の病気や疾患の発症と進行の一因となりうる(Cohen & Herbert, 1996)。
The scientific study of how stress and other psychological factors impact health falls within the realm of health psychology, a subfield of psychology devoted to understanding the importance of psychological influences on health, illness, and how people respond when they become ill (Taylor, 1999). Health psychology emerged as a discipline in the 1970s, a time during which there was increasing awareness of the role behavioral and lifestyle factors play in the development of illnesses and diseases (Straub, 2007). In addition to studying the connection between stress and illness, health psychologists investigate issues such as why people make certain lifestyle choices (e.g., smoking or eating unhealthy food despite knowing the potential adverse health implications of such behaviors). Health psychologists also design and investigate the effectiveness of interventions aimed at changing unhealthy behaviors. Perhaps one of the more fundamental tasks of health psychologists is to identify which groups of people are especially at risk for negative health outcomes, based on psychological or behavioral factors. For example, measuring differences in stress levels among demographic groups and how these levels change over time can help identify populations who may have an increased risk for illness or disease.
英語のヒント
ストレスやそのほかの心理的要因が健康にどのように影響するかについての科学的研究は、健康心理学の領域に含まれる。健康心理学とは、健康、病気、そして人が病気になったときにどう反応するかに対する心理的な影響の重要性を理解することに専念する、心理学の下位分野である(Taylor, 1999)。健康心理学が一つの学問分野として現れたのは1970年代であり、当時は、病気や疾患の発生において行動やライフスタイルの要因が果たす役割への認識が高まりつつあった(Straub, 2007)。健康心理学者は、ストレスと病気の結びつきを研究するだけでなく、人はなぜ特定のライフスタイルを選ぶのか(たとえば、そうした行動が健康に悪影響を及ぼしうると知っているにもかかわらず、喫煙したり不健康な食べ物を食べたりするのはなぜか)といった問題も調べる。健康心理学者はまた、不健康な行動を変えることを目指した介入を考案し、その効果を調べる。健康心理学者のより基本的な仕事の一つは、おそらく、心理的あるいは行動的な要因に基づいて、どの集団の人々が健康上の悪い結果に陥るリスクが特に高いかを特定することだろう。たとえば、人口統計学的集団のあいだのストレス水準の違いと、その水準が時間とともにどう変化するかを測定することは、病気や疾患のリスクが高まっているかもしれない集団を特定するのに役立ちうる。
Figure 14.6 depicts the results of three national surveys in which several thousand individuals from different demographic groups completed a brief stress questionnaire; the surveys were administered in 1983, 2006, and 2009 (Cohen & Janicki-Deverts, 2012). All three surveys demonstrated higher stress in women than in men. Unemployed individuals reported high levels of stress in all three surveys, as did those with less education and income; retired persons reported the lowest stress levels. However, from 2006 to 2009 the greatest increase in stress levels occurred among men, Hispanic people aged 45–64, college graduates, and those with full-time employment. One interpretation of these findings is that concerns surrounding the 2008–2009 economic downturn (e.g., threat of or actual job loss and substantial loss of retirement savings) may have been especially stressful to college-educated employed men with limited time remaining in their working careers.
英語のヒント
図14.6は、三つの全国調査の結果を示している。これらの調査では、さまざまな人口統計学的集団に属する数千人が、短いストレス質問紙に回答した。調査は1983年、2006年、2009年に実施された(Cohen & Janicki-Deverts, 2012)。三つの調査のすべてで、女性のほうが男性よりもストレスが高かった。失業者は三つの調査のすべてで高いストレスを報告し、教育水準や所得の低い人々も同様だった。退職者が報告したストレスの水準は最も低かった。しかし、2006年から2009年にかけてストレスの水準が最も大きく増加したのは、男性、45〜64歳のヒスパニック系の人々、大学卒業者、そして常勤で雇用されている人々だった。これらの結果の一つの解釈は、2008〜2009年の景気後退をめぐる不安(たとえば、失業の恐れや実際の失業、老後に備えた貯蓄の大幅な損失)が、職業人生の残り時間が限られた、大学教育を受けて雇用されている男性にとって、特にストレスの大きいものだったのかもしれない、というものである。
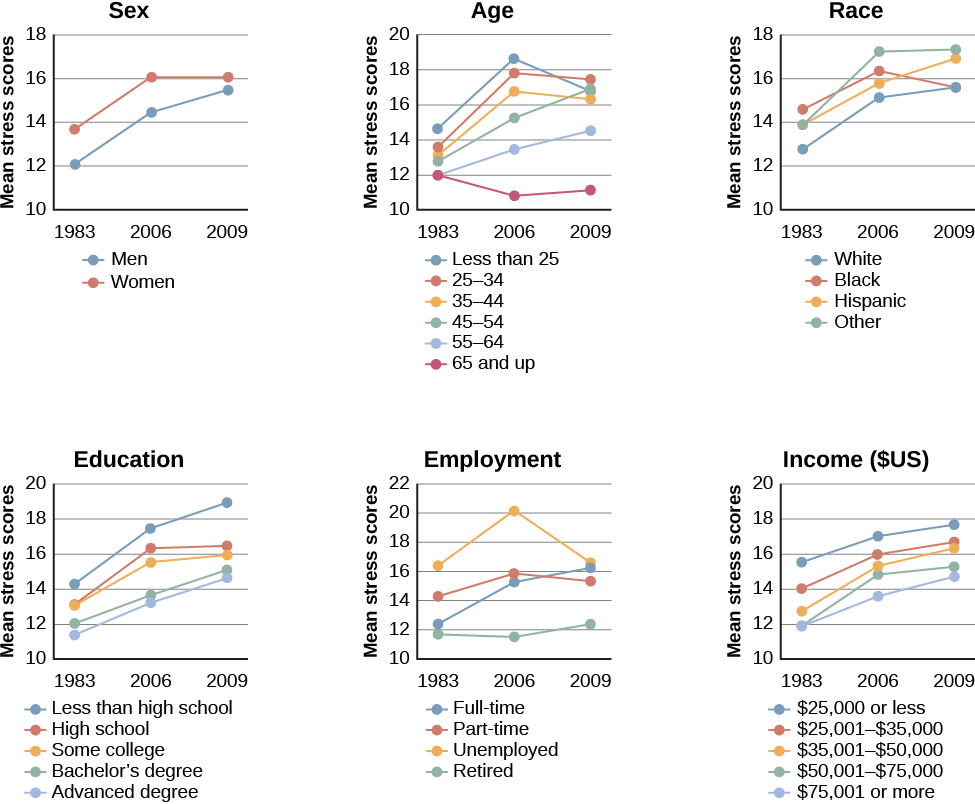


Figure 14.6図 14.6
The charts above, adapted from Cohen & Janicki-Deverts (2012), depict the mean stress level scores among different demographic groups during the years 1983, 2006, and 2009. Across categories of sex, age, race, education level, employment status, and income, stress levels generally show a marked increase over this quarter-century time span.
上のグラフは、コーエンとジャニッキ=デヴァーツ(2012)をもとに作成したもので、1983年、2006年、2009年の各年における、さまざまな人口統計学的集団のストレス得点の平均値を示している。性別、年齢、人種、教育水準、雇用状態、所得のどのカテゴリーでも、ストレスの水準はこの四半世紀のあいだに、概してはっきりと増加している。