第9章1標本による仮説検定
9.5 Additional Information and Full Hypothesis Test Examples9.5 追加の情報と仮説検定の一連の例
- In a hypothesis test problem, you may see words such as "the level of significance is 1%." The "1%" is the preconceived or preset α.仮説検定の問題に「有意水準は1%」などと書かれることがある。この「1%」が、事前に定めた、または設定済みのαである。
- The statistician setting up the hypothesis test selects the value of α to use before collecting the sample data.
英語のヒント
仮説検定を計画する統計学者は、標本データを集める前に、使うαの値を選ぶ。 - If no level of significance is given, a common standard to use is α = 0.05.有意水準が与えられていない場合、一般的な基準はα = 0.05である。
- When you calculate the p-value and draw the picture, the p-value is the area in the left tail, the right tail, or split evenly between the two tails. For this reason, we call the hypothesis test left, right, or two tailed.p値を計算して図を描くと、その値は左裾の面積、右裾の面積、または両裾に等分された面積となる。そのため、仮説検定を左片側検定、右片側検定、両側検定と呼ぶ。
- The alternative hypothesis, , tells you if the test is left, right, or two-tailed. It is the key to conducting the appropriate test.対立仮説を見れば、左片側・右片側・両側のどの検定かが分かる。適切な検定を行う鍵となる。
- Ha never has a symbol that contains an equal sign.Haには、等号を含む記号は決して使わない。
- Thinking about the meaning of the p-value: A data analyst (and anyone else) should have more confidence that he made the correct decision to reject the null hypothesis with a smaller p-value (for example, 0.001 as opposed to 0.04) even if using the 0.05 level for alpha. Similarly, for a large p-value such as 0.4, as opposed to a p-value of 0.056 (alpha = 0.05 is less than either number), a data analyst should have more confidence that she made the correct decision in not rejecting the null hypothesis. This makes the data analyst use judgment rather than mindlessly applying rules.
英語のヒント
p値の意味を考える:α = 0.05を使う場合でも、p値が小さいほど(たとえば0.04に対して0.001)、データ分析者もほかの人も、帰無仮説を棄却した判断が正しいという確信を強めるべきである。同様に、p値が0.056より0.4のように大きい場合(α = 0.05はどちらの値よりも小さい)、帰無仮説を棄却しない判断が正しいという確信を強めるべきである。これにより、分析者は規則を機械的に当てはめるだけでなく、判断を働かせる。
The following examples illustrate a left-, right-, and two-tailed test.
以下の例で、左片側・右片側・両側の検定を示す。
Example 9.11例題 9.11
Ho: μ = 5, Ha: μ < 5
Test of a single population mean. Ha tells you the test is left-tailed. The picture of the p-value is as follows:
1つの母平均の検定。Haから左片側検定だと分かる。p値の図は次のとおりである:
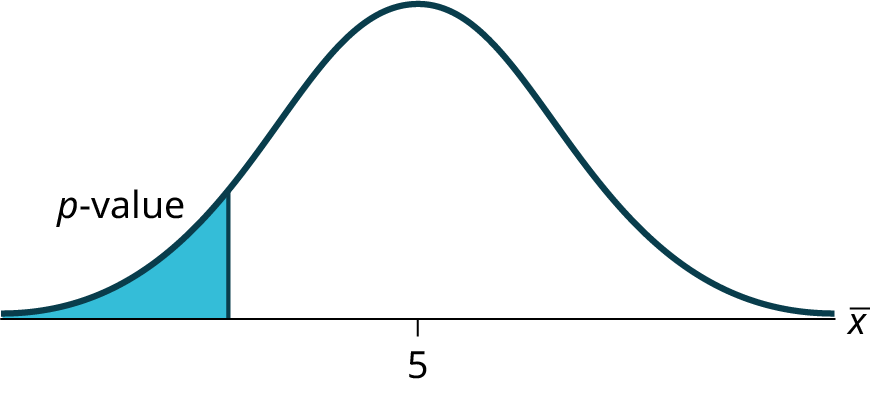
Figure 9.4図 9.4
Example 9.12例題 9.12
H0: p ≤ 0.2 Ha: p > 0.2
This is a test of a single population proportion. Ha tells you the test is right-tailed. The picture of the p-value is as follows:
これは1つの母比率の検定である。Haから右片側検定だと分かる。p値の図は次のとおりである:
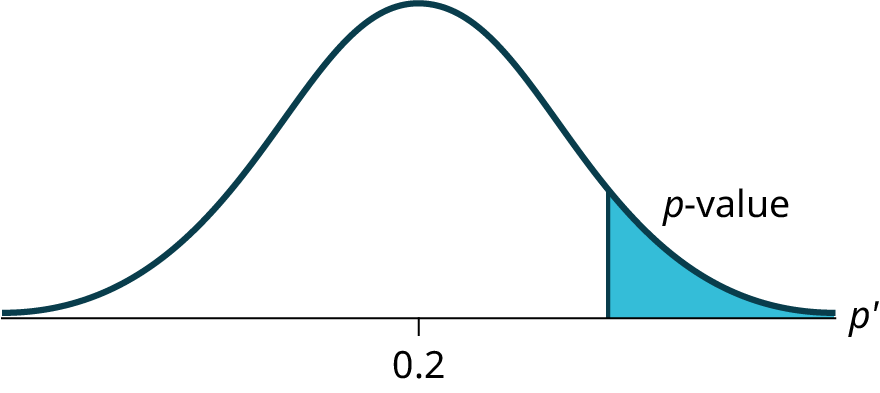
Figure 9.5図 9.5
Example 9.13例題 9.13
H0: p = 50 Ha: p ≠ 50
This is a test of a single population mean. Ha tells you the test is two-tailed. The picture of the p-value is as follows.
これは1つの母平均の検定である。Haから両側検定だと分かる。p値の図は次のとおりである。
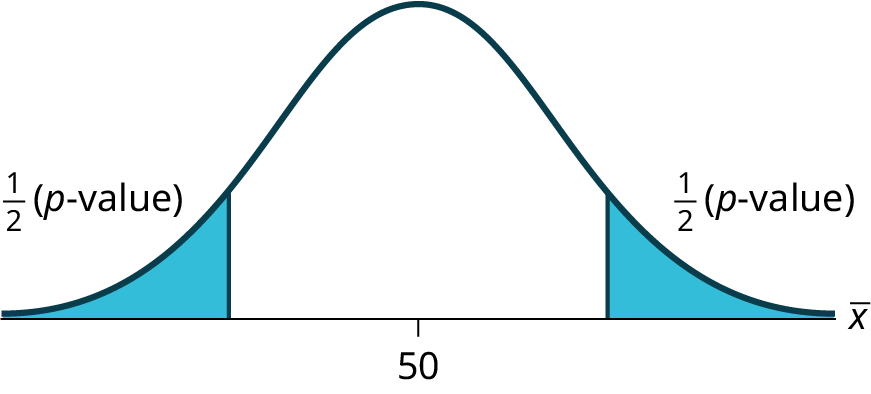
Figure 9.6図 9.6
Full Hypothesis Test Examples仮説検定の一連の例
Example 9.14例題 9.14
Jeffrey, as an eight-year old, established a mean time of 16.43 seconds for swimming the 25-yard freestyle, with a standard deviation of 0.8 seconds. His dad, Frank, thought that Jeffrey could swim the 25-yard freestyle faster using goggles. Frank bought Jeffrey a new pair of expensive goggles and timed Jeffrey for 15 25-yard freestyle swims. For the 15 swims, Jeffrey's mean time was 16 seconds. Frank thought that the goggles helped Jeffrey to swim faster than the 16.43 seconds. Conduct a hypothesis test using a preset α = 0.05. Assume that the swim times for the 25-yard freestyle are normal.
英語のヒント
8歳のジェフリーは、25ヤード自由形で平均16.43秒、標準偏差0.8秒という記録を出していた。父フランクは、ゴーグルを使えばもっと速く泳げると考えた。高価な新品のゴーグルを買い、ジェフリーに25ヤード自由形を15回泳がせて計時すると、平均タイムは16秒だった。フランクは、ゴーグルのおかげで16.43秒より速く泳げたと考えた。事前にα = 0.05と定め、仮説検定を行え。25ヤード自由形のタイムは正規分布に従うものとする。
Solution解き方
Set up the Hypothesis Test:
仮説検定を設定する:
Since the problem is about a mean, this is a test of a single population mean.
問題は平均についてなので、1つの母平均の検定である。
H0: μ = 16.43 Ha: μ < 16.43
For Jeffrey to swim faster, his time will be less than 16.43 seconds. The "<" tells you this is left-tailed.
ジェフリーが速く泳ぐなら、タイムは16.43秒未満になる。「<」から左片側検定だと分かる。
Determine the distribution needed:
必要な分布を定める:
Random variable: = the mean time to swim the 25-yard freestyle.
確率変数: = 25ヤード自由形を泳ぐ平均時間。
Distribution for the test: is normal (population standard deviation is known: σ = 0.8)
検定に使う分布:は正規分布に従う(母標準偏差はσ = 0.8と既知)。
Therefore,
。したがって、。
μ = 16.43 comes from H0 and not the data. σ = 0.8, and n = 15.
μ = 16.43はデータからではなくH0から得られる。σ = 0.8、n = 15である。
Calculate the p-value using the normal distribution for a mean:
平均の正規分布を使ってp値を計算する:
p-value = P( < 16) = 0.0187 where the sample mean in the problem is given as 16.
p値 = P( < 16) = 0.0187。問題で与えられた標本平均は16である。
p-value = 0.0187 (This is called the actual level of significance.) The p-value is the area to the left of the sample mean is given as 16.
p値 = 0.0187(実際の有意水準と呼ばれる)。p値は、16と与えられた標本平均より左側の面積である。
Graph:
グラフ:
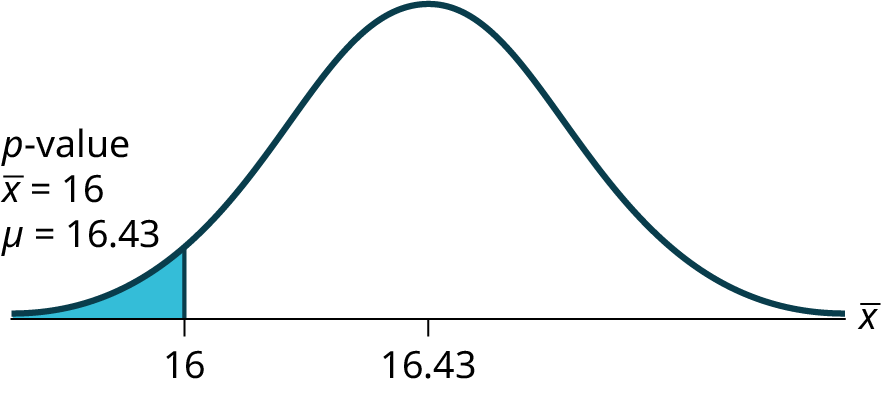
Figure 9.7図 9.7
μ = 16.43 comes from H0. Our assumption is μ = 16.43.
μ = 16.43はH0から得られる。μ = 16.43と仮定している。
Interpretation of the p-value: If H0 is true, there is a 0.0187 probability (1.87%)that Jeffrey's mean time to swim the 25-yard freestyle is 16 seconds or less. Because a 1.87% chance is small, the mean time of 16 seconds or less is unlikely to have happened randomly. It is a rare event.
p値の解釈:H0が真なら、ジェフリーの25ヤード自由形の平均タイムが16秒以下になる確率は0.0187(1.87%)である。1.87%は小さいため、平均16秒以下という結果が偶然に生じたとは考えにくい。まれな事象である。
Compare α and the p-value:
αとp値を比較する:
α = 0.05 p-value = 0.0187 α > p-value
α = 0.05、p値 = 0.0187、α > p値。
Make a decision: Since p-value, reject H0.
判断:p値なので、H0を棄却する。
This indicates that you reject the null hypothesis that the mean time to swim the 25-yard freestyle is at least 16.43 seconds.
これは、「25ヤード自由形の平均タイムは16.43秒以上」という帰無仮説を棄却することを示す。
Conclusion: At the 5% significance level, there is sufficient evidence that Jeffrey's mean time to swim the 25-yard freestyle is less than 16.43 seconds. Thus, based on the sample data, we conclude that Jeffrey swims faster using the new goggles.
結論:有意水準5%で、ジェフリーの25ヤード自由形の平均タイムが16.43秒未満であるという十分な証拠がある。したがって、標本データに基づき、新しいゴーグルを使うとジェフリーはより速く泳ぐと結論づける。
The Type I and Type II errors for this problem are as follows:
The Type I error is to conclude that Jeffrey swims the 25-yard freestyle, on average, in less than 16.43 seconds when, in fact, he actually swims the 25-yard freestyle, on average, in at least 16.43 seconds. (Reject the null hypothesis when the null hypothesis is true.)
The Type I error is to conclude that Jeffrey swims the 25-yard freestyle, on average, in less than 16.43 seconds when, in fact, he actually swims the 25-yard freestyle, on average, in at least 16.43 seconds. (Reject the null hypothesis when the null hypothesis is true.)
この問題の第1種と第2種の過誤は次のとおりである。第1種の過誤は、実際の25ヤード自由形の平均タイムが16.43秒以上なのに、16.43秒未満で泳ぐと結論づけることである。(真の帰無仮説を棄却する。)
The Type II error is that there is not evidence to conclude that Jeffrey swims the 25-yard freestyle, on average, in less than 16.43 seconds when, in fact, he actually does swim the 25-yard free-style, on average, in less than 16.43 seconds. (Do not reject the null hypothesis when the null hypothesis is false.)
第2種の過誤は、実際にはジェフリーが25ヤード自由形を平均16.43秒未満で泳ぐのに、そのように結論づける証拠がないとすることである。(偽の帰無仮説を棄却しない。)
Using the Calculator電卓の操作
Using the Calculator電卓の操作
Example 9.15例題 9.15
A college football coach records the mean weight that the players can bench press as 275 pounds, with a standard deviation of 55 pounds. Three of the players thought that the mean weight was more than that amount. They asked 30 of their teammates for their estimated maximum lift on the bench press exercise. The data ranged from 205 pounds to 385 pounds. The actual different weights were (frequencies are in parentheses)
大学のアメリカンフットボールのコーチは、選手がベンチプレスで上げられる重量を平均275ポンド、標準偏差55ポンドと記録している。3人の選手は平均がもっと重いと考え、チームメート30人に、自分が上げられる最大重量の推定値を尋ねた。データは205~385ポンドだった。各重量は次のとおりである(括弧内は度数):
- 205(3)
- 215(3)
- 225(1)
- 241(2)
- 252(2)
- 265(2)
- 275(2)
- 313(2)
- 316(5)
- 338(2)
- 341(1)
- 345(2)
- 368(2)
- 385(1)
.
Conduct a hypothesis test using a 2.5% level of significance to determine if the bench press mean is more than 275 pounds.
平均ベンチプレス重量が275ポンドを超えるかを、有意水準2.5%で仮説検定せよ。
Solution解き方
Set up the Hypothesis Test:
仮説検定を設定する:
Since the problem is about a mean weight, this is a test of a single population mean.
問題は平均重量についてなので、1つの母平均の検定である。
H0: μ = 275
Ha: μ > 275
This is a right-tailed test.
Ha: μ > 275
This is a right-tailed test.
H0:μ = 275、Ha:μ > 275。これは右片側検定である。
Calculating the distribution needed:
必要な分布を求める:
Random variable: = the mean weight, in pounds, lifted by the football players.
確率変数: = フットボール選手が上げる平均重量(ポンド)。
Distribution for the test: It is normal because σ is known.
検定に使う分布:σが既知なので正規分布である。
pounds (from the data).
ポンド(データから求める)。
σ = 55 pounds (Always use σ if you know it.) We assume μ = 275 pounds unless our data shows us otherwise.
σ = 55ポンド(σが既知なら必ず使う)。データが反対を示さない限り、μ = 275ポンドと仮定する。
Calculate the p-value using the normal distribution for a mean and using the sample mean as input (see NOTEs for the TI-83, 83+, 84, 84+ Calculators for using the data as input):
平均の正規分布を使い、標本平均を入力してp値を計算する(データを入力する方法は「TI-83、83+、84、84+の電卓に関する注記」を参照):
.
。
Interpretation of the p-value: If H0 is true, then there is a 0.1331 probability (13.23%) that the football players can lift a mean weight of 286.2 pounds or more. Because a 13.23% chance is large enough, a mean weight lift of 286.2 pounds or more is not a rare event.
p値の解釈:H0が真なら、選手が平均286.2ポンド以上を上げる確率は0.1331(13.23%)である。13.23%という確率は十分大きいので、平均286.2ポンド以上を上げることはまれな事象ではない。
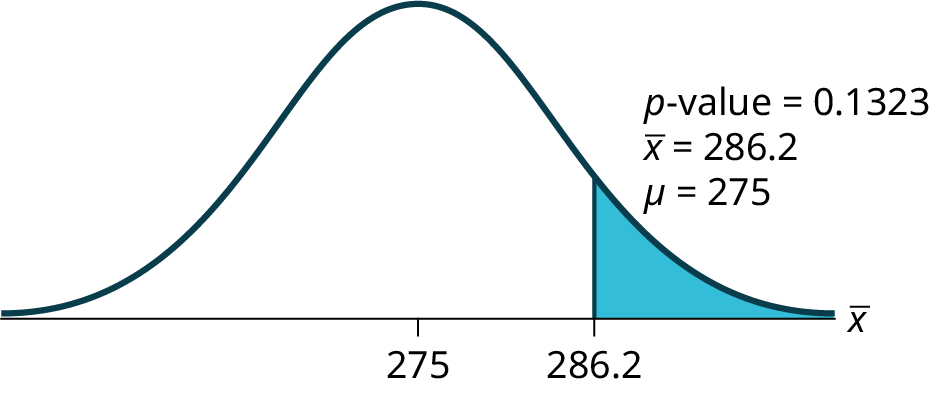
Figure 9.9図 9.9
Compare α and the p-value:
αとp値を比較する:
α = 0.025 p-value = 0.1323
α = 0.025、p値 = 0.1323。
Make a decision: Since α <p-value, do not reject H0.
判断:α < p値なので、H0を棄却しない。
Conclusion: At the 2.5% level of significance, from the sample data, there is not sufficient evidence to conclude that the true mean weight lifted is more than 275 pounds.
結論:有意水準2.5%では、真の平均挙上重量が275ポンドを超えると結論づける十分な証拠は、標本データから得られない。
Using the Calculator電卓の操作
Example 9.16例題 9.16
Statistics students believe that the mean score on the first statistics test is 65. A statistics instructor thinks the mean score is higher than 65. He samples ten statistics students and obtains the scores
統計学の学生たちは、最初の試験の平均点は65だと考えている。教員は65より高いと考えている。10人を標本として選び、次の点数を得た:
- 65
- 65
- 70
- 67
- 66
- 63
- 63
- 68
- 72
- 71
. He performs a hypothesis test using a 5% level of significance. The data are assumed to be from a normal distribution.
教員は有意水準5%で仮説検定を行う。データは正規分布から得られたものと仮定する。
Solution解き方
Set up the hypothesis test:
仮説検定を設定する:
A 5% level of significance means that α = 0.05. This is a test of a single population mean.
有意水準5%はα = 0.05を意味する。これは1つの母平均の検定である。
H0: μ = 65 Ha: μ > 65
Since the instructor thinks the average score is higher, use a ">". The ">" means the test is right-tailed.
教員は平均点が高いと考えているので、「>」を使う。この記号は右片側検定を意味する。
Determine the distribution needed:
必要な分布を定める:
Random variable: = average score on the first statistics test.
確率変数: = 最初の統計学の試験の平均点。
Distribution for the test: If you read the problem carefully, you will notice that there is no population standard deviation given. You are only given n = 10 sample data values. Notice also that the data come from a normal distribution. This means that the distribution for the test is a student's t.
英語のヒント
検定に使う分布:問題をよく読むと、母標準偏差が与えられていないことに気づく。与えられたのはn = 10個の標本データだけである。また、データは正規分布から得られている。したがって、検定に使う分布はスチューデントのt分布である。
Use tdf. Therefore, the distribution for the test is t9 where n = 10 and df = 10 - 1 = 9.
tdfを使う。n = 10、df = 10 − 1 = 9なので、検定に使う分布はt9である。
Calculate the p-value using the Student's t-distribution:
スチューデントのt分布を使ってp値を計算する:
p-value = P( > 67) = 0.0396 where the sample mean and sample standard deviation are calculated as 67 and 3.1972 from the data.
p値 = P( > 67) = 0.0396。標本平均67と標本標準偏差3.1972は、データから計算する。
Interpretation of the p-value: If the null hypothesis is true, then there is a 0.0396 probability (3.96%) that the sample mean is 67 or more.
p値の解釈:帰無仮説が真なら、標本平均が67以上となる確率は0.0396(3.96%)である。
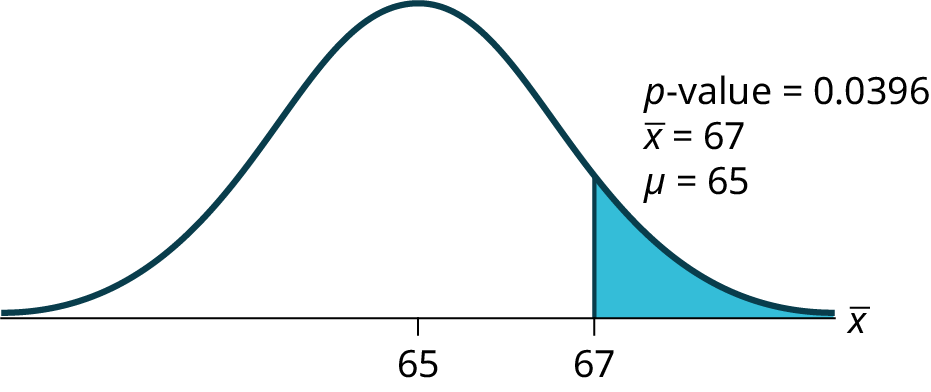
Figure 9.10図 9.10
Compare α and the p-value:
αとp値を比較する:
Since α = 0.05 and p-value = 0.0396. α > p-value.
α = 0.05、p値 = 0.0396なので、α > p値である。
Make a decision: Since α > p-value, reject H0.
判断:α > p値なので、H0を棄却する。
This means you reject μ = 65. In other words, you believe the average test score is greater than 65.
これはμ = 65を棄却することを意味する。言い換えると、平均試験点は65より高いと考える。
Conclusion: At a 5% level of significance, the sample data show sufficient evidence that the mean (average) test score is greater than 65, just as the math instructor thinks.
結論:有意水準5%で、数学の教員が考えたとおり、平均試験点が65より高いという十分な証拠を標本データは示している。
Using the Calculator電卓の操作
Example 9.17例題 9.17
Joon believes that 50% of first-time brides in the United States are younger than their grooms. She performs a hypothesis test to determine if the percentage is the same or different from 50%. Joon samples 100 first-time brides and 53 reply that they are younger than their grooms. For the hypothesis test, she uses a 1% level of significance.
英語のヒント
ジュンは、米国の初婚の花嫁の50%が花婿より年下だと考えている。この割合が50%と同じか異なるかを仮説検定する。初婚の花嫁100人を標本とすると、53人が花婿より年下と答えた。有意水準は1%とする。
Solution解き方
Set up the hypothesis test:
仮説検定を設定する:
The 1% level of significance means that α = 0.01. This is a test of a single population proportion.
有意水準1%はα = 0.01を意味する。これは1つの母比率の検定である。
H0: p = 0.50 Ha: p ≠ 0.50
The words "is the same or different from" tell you this is a two-tailed test.
「同じか異なるか」という言葉から、両側検定だと分かる。
Calculate the distribution needed:
必要な分布を求める:
Random variable: P′ = the percent of of first-time brides who are younger than their grooms.
確率変数:P′ = 初婚の花嫁のうち、花婿より年下の人の割合。
Distribution for the test: The problem contains no mention of a mean. The information is given in terms of percentages. Use the distribution for P′, the estimated proportion.
検定に使う分布:問題に平均への言及はなく、情報は百分率で与えられている。推定比率P′の分布を使う。
Therefore,
。したがって、。
where p = 0.50, q = 1−p = 0.50, and n = 100
ここでp = 0.50、q = 1 − p = 0.50、n = 100である。
Calculate the p-value using the normal distribution for proportions:
比率の正規分布を使ってp値を計算する:
p-value = P (p′ < 0.47 or p′ > 0.53) = 0.5485
p値 = P(p′ < 0.47 または p′ > 0.53) = 0.5485
where x = 53, p′ = = 0.53.
ここでx = 53、p′ = = 0.53である。
Interpretation of the p-value: If the null hypothesis is true, there is 0.5485 probability (54.85%) that the sample (estimated) proportion is 0.53 or more OR 0.47 or less (see the graph in Figure 9.11).
p値の解釈:帰無仮説が真なら、標本比率(推定比率)が0.53以上、または0.47以下となる確率は0.5485(54.85%)である(図9.11のグラフ参照)。
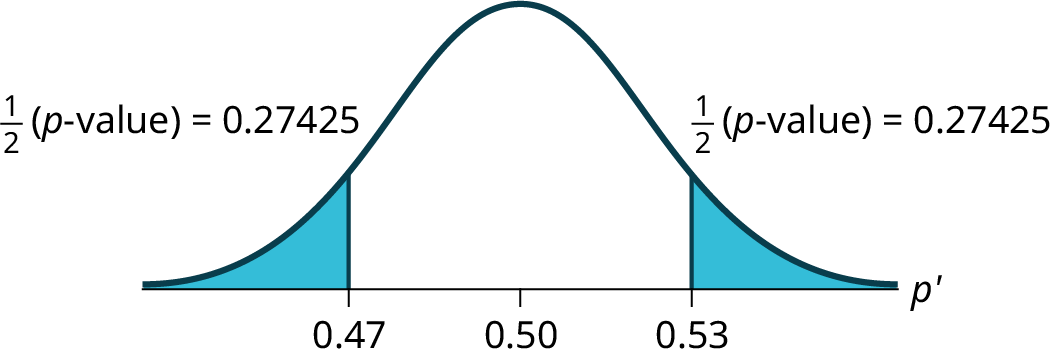
Figure 9.11図 9.11
μ = p = 0.50 comes from H0, the null hypothesis.
μ = p = 0.50は帰無仮説H0から得られる。
p′ = 0.53. Since the curve is symmetrical and the test is two-tailed, the p′ for the left tail is equal to 0.50 – 0.03 = 0.47 where μ = p = 0.50. (0.03 is the difference between 0.53 and 0.50.)
p′ = 0.53である。曲線が対称で両側検定なので、左裾に対応するp′は0.50 − 0.03 = 0.47となる。ここでμ = p = 0.50である。(0.03は0.53と0.50の差である。)
Compare α and the p-value:
αとp値を比較する:
Since α = 0.01 and p-value = 0.5485. α < p-value.
α = 0.01、p値 = 0.5485なので、α < p値である。
Make a decision: Since α < p-value, you cannot reject H0.
判断:α < p値なので、H0を棄却できない。
Conclusion: At the 1% level of significance, the sample data do not show sufficient evidence that the percentage of first-time brides who are younger than their grooms is different from 50%.
結論:有意水準1%では、花婿より年下の初婚の花嫁の割合が50%と異なるという十分な証拠を、標本データは示していない。
Using the Calculator電卓の操作
The Type I and Type II errors are as follows:
第1種と第2種の過誤は次のとおりである:
The Type I error is to conclude that the proportion of first-time brides who are younger than their grooms is different from 50% when, in fact, the proportion is actually 50%. (Reject the null hypothesis when the null hypothesis is true).
第1種の過誤は、花婿より年下の初婚の花嫁の比率が実際には50%なのに、50%と異なると結論づけることである。(真の帰無仮説を棄却する。)
The Type II error is there is not enough evidence to conclude that the proportion of first time brides who are younger than their grooms differs from 50% when, in fact, the proportion does differ from 50%. (Do not reject the null hypothesis when the null hypothesis is false.)
第2種の過誤は、実際には比率が50%と異なるのに、花婿より年下の初婚の花嫁の比率が50%と異なると結論づける十分な証拠がないとすることである。(偽の帰無仮説を棄却しない。)
Example 9.18例題 9.18
Suppose a consumer group suspects that the proportion of households that have three cell phones is 30%. A cell phone company has reason to believe that the proportion is not 30%. Before they start a big advertising campaign, they conduct a hypothesis test. Their marketing people survey 150 households with the result that 43 of the households have three cell phones.
英語のヒント
消費者団体が、携帯電話を3台持つ世帯の比率は30%だろうと考えている。携帯電話会社には、30%ではないと考える理由がある。大きな広告キャンペーンを始める前に、仮説検定を行う。マーケティング担当者が150世帯を調査すると、43世帯が携帯電話を3台持っていた。
a. The value that helps determine the p-value is p′. Calculate p′.
a. p値を求めるために使う値はp′である。p′を計算せよ。
b. What is a success for this problem?
b. この問題の「成功」とは何か。
c. What is the level of significance?
c. 有意水準はいくらか。
d. Draw the graph for this problem. Draw the horizontal axis. Label and shade appropriately.
Calculate the p-value.
Calculate the p-value.
d. この問題のグラフを描け。横軸を描き、適切に値を書いて領域を塗れ。p値を計算せよ。
e. Make a decision. _____________(Reject/Do not reject) H0 because____________.
e. 判断せよ。____________なので、H0を_____________(棄却する/棄却しない)。
Solution解き方
Set up the Hypothesis Test:
仮説検定を設定する:
H0: p = 0.30 Ha: p ≠ 0.30
Determine the distribution needed:
必要な分布を定める:
The random variable is P′ = proportion of households that have three cell phones.
確率変数は、P′ = 携帯電話を3台持つ世帯の比率である。
The distribution for the hypothesis test is
仮説検定に使う分布はである。
a. p′ = where x is the number of successes and n is the total number in the sample.
a. p′ = 。xは成功回数、nは標本の総数である。
x = 43, n = 150
p′ =
b. A success is having three cell phones in a household.
b. 成功とは、世帯が携帯電話を3台持っていることである。
c. The level of significance is the preset α. Since α is not given, assume that α = 0.05.
c. 有意水準は事前に定めたαである。指定がないため、α = 0.05とする。
d. p-value = 0.7216
d. p値 = 0.7216
e. Assuming that α = 0.05, α < p-value. The decision is do not reject H0 because there is not sufficient evidence to conclude that the proportion of households that have three cell phones is not 30%.
e. α = 0.05とすると、α < p値である。携帯電話を3台持つ世帯の比率が30%ではないと結論づける十分な証拠がないため、H0を棄却しない。
The next example is a poem written by a statistics student named Nicole Hart. The solution to the problem follows the poem. Notice that the hypothesis test is for a single population proportion. This means that the null and alternate hypotheses use the parameter p. The distribution for the test is normal. The estimated proportion p′ is the proportion of fleas killed to the total fleas found on Fido. This is sample information. The problem gives a preconceived α = 0.01, for comparison, and a 95% confidence interval computation. The poem is clever and humorous, so please enjoy it!
次の例は、統計学の学生ニコール・ハートが書いた詩である。詩の後に解答が続く。検定は1つの母比率について行うので、帰無仮説と対立仮説は母数pを使う。検定の分布は正規分布である。推定比率p′は、犬のファイドにいたノミの総数に対して死んだノミの比率であり、標本情報である。問題は比較のためのα = 0.01を事前に指定し、95%信頼区間の計算も求めている。工夫とユーモアのある詩を楽しんでほしい。
Example 9.19例題 9.19
My dog has so many fleas,
They do not come off with ease.
As for shampoo, I have tried many types
Even one called Bubble Hype,
Which only killed 25% of the fleas,
Unfortunately I was not pleased.
I've used all kinds of soap,
Until I had given up hope
Until one day I saw
An ad that put me in awe.
A shampoo used for dogs
Called GOOD ENOUGH to Clean a Hog
Guaranteed to kill more fleas.
I gave Fido a bath
And after doing the math
His number of fleas
Started dropping by 3's!
Before his shampoo
I counted 42.
At the end of his bath,
I redid the math
And the new shampoo had killed 17 fleas.
So now I was pleased.
Now it is time for you to have some fun
With the level of significance being .01,
You must help me figure out
Use the new shampoo or go without?
They do not come off with ease.
As for shampoo, I have tried many types
Even one called Bubble Hype,
Which only killed 25% of the fleas,
Unfortunately I was not pleased.
I've used all kinds of soap,
Until I had given up hope
Until one day I saw
An ad that put me in awe.
A shampoo used for dogs
Called GOOD ENOUGH to Clean a Hog
Guaranteed to kill more fleas.
I gave Fido a bath
And after doing the math
His number of fleas
Started dropping by 3's!
Before his shampoo
I counted 42.
At the end of his bath,
I redid the math
And the new shampoo had killed 17 fleas.
So now I was pleased.
Now it is time for you to have some fun
With the level of significance being .01,
You must help me figure out
Use the new shampoo or go without?
英語のヒント
うちの犬にはノミがたくさん。そう簡単には離れない。シャンプーなら何種類も試した。「バブル・ハイプ」という品まで。でも死んだノミは25%。残念ながら満足できなかった。あらゆる石けんを使い、ついには望みも捨てかけた。そんなある日、目を見張る広告を見た。犬用シャンプー、その名は「豚も洗えるほど十分」。もっと多くのノミを退治すると保証する。ファイドをお風呂に入れ、数を数えてみると、ノミは3匹ずつ減り始めた! シャンプー前に数えたのは42匹。お風呂の終わりにもう一度計算したら、新しいシャンプーで17匹死んでいた。今度は満足。さあ、ここからはあなたの楽しむ番。有意水準は.01。新しいシャンプーを使うべきか、使わずに済ますべきか。私が答えを出せるよう助けてほしい。
Solution解き方
Set up the hypothesis test:
仮説検定を設定する:
H0: p ≤ 0.25 Ha: p > 0.25
Determine the distribution needed:
必要な分布を定める:
In words, CLEARLY state what your random variable or P′ represents.
確率変数またはP′が何を表すか、言葉ではっきり示せ。
P′ = The proportion of fleas that are killed by the new shampoo
P′ = 新しいシャンプーで死ぬノミの比率。
State the distribution to use for the test.
検定に使う分布を示せ。
Normal:
正規分布:
Test Statistic: z = 2.3163
検定統計量:z = 2.3163
Calculate the p-value using the normal distribution for proportions:
比率の正規分布を使ってp値を計算する:
p-value = 0.0103
p値 = 0.0103
In one to two complete sentences, explain what the p-value means for this problem.
この問題でp値が何を意味するかを、1~2個の完結した文で説明せよ。
If the null hypothesis is true (the proportion is 0.25), then there is a 0.0103 probability that the sample (estimated) proportion is 0.4048 or more.
帰無仮説(比率は0.25)が真なら、標本比率(推定比率)が0.4048 以上となる確率は0.0103である。
Use the previous information to sketch a picture of this situation. CLEARLY, label and scale the horizontal axis and shade the region(s) corresponding to the p-value.
以上の情報から、この状況の図を描け。横軸に目盛りと値を明確に記し、p値に対応する領域を塗れ。
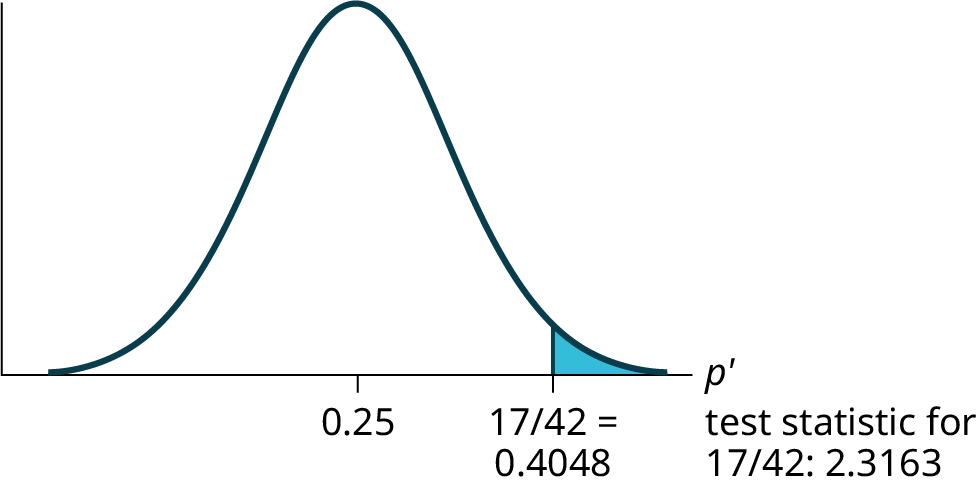
Figure 9.12図 9.12
Compare α and the p-value:
αとp値を比較する:
Indicate the correct decision (“reject” or “do not reject” the null hypothesis), the reason for it, and write an appropriate conclusion, using complete sentences.
正しい判断(帰無仮説を「棄却する」または「棄却しない」)とその理由を示し、適切な結論を完結した文で書け。
alpha アルファ |
decision 判断 |
reason for decision 判断の理由 |
|---|---|---|
0.01 |
Do not reject を棄却しない |
α < p-value α < p値 |
Conclusion: At the 1% level of significance, the sample data do not show sufficient evidence that the percentage of fleas that are killed by the new shampoo is more than 25%.
結論:有意水準1%では、新しいシャンプーで死ぬノミの割合が25%を超えるという十分な証拠を、標本データは示していない。
Construct a 95% confidence interval for the true mean or proportion. Include a sketch of the graph of the situation. Label the point estimate and the lower and upper bounds of the confidence interval.
真の平均または比率の95%信頼区間を作れ。状況を表すグラフの概形も描き、点推定値、信頼区間の下限と上限を示せ。
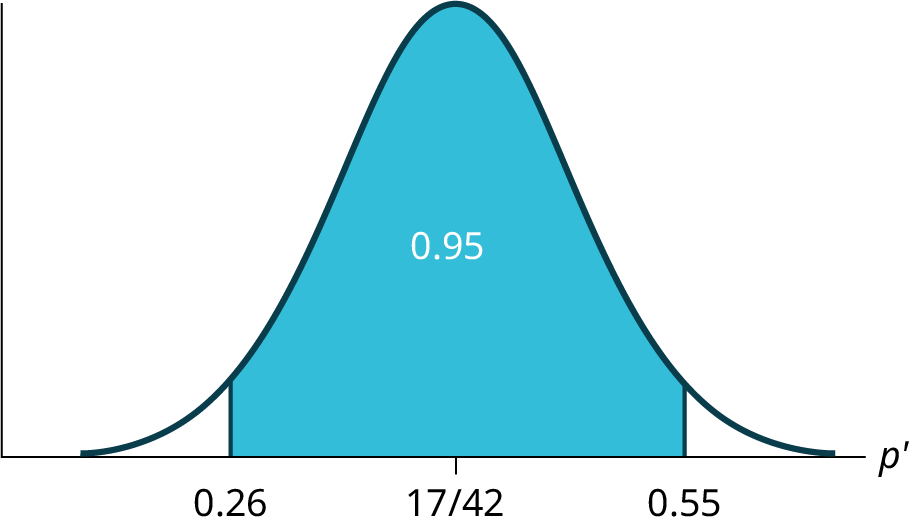
Figure 9.13図 9.13
Confidence Interval: (0.26,0.55) We are 95% confident that the true population proportion p of fleas that are killed by the new shampoo is between 26% and 55%.
信頼区間:(0.26, 0.55)。新しいシャンプーで死ぬノミの真の母比率pは26%から55%の間にあると、95%の信頼度でいえる。
Example 9.20例題 9.20
The National Institute of Standards and Technology provides exact data on conductivity properties of materials. Following are conductivity measurements for 11 randomly selected pieces of a particular type of glass.
英語のヒント
米国国立標準技術研究所は、材料の伝導性について正確なデータを提供している。以下は、ある種類のガラスから無作為に選んだ11片の伝導率の測定値である。
1.11; 1.07; 1.11; 1.07; 1.12; 1.08; .98; .98; 1.02; .95; .95
Is there convincing evidence that the average conductivity of this type of glass is greater than one? Use a significance level of 0.05. Assume the population is normal.
Is there convincing evidence that the average conductivity of this type of glass is greater than one? Use a significance level of 0.05. Assume the population is normal.
1.11; 1.07; 1.11; 1.07; 1.12; 1.08; .98; .98; 1.02; .95; .95。この種類のガラスの平均伝導率が1より大きいという、説得力のある証拠はあるか。有意水準0.05を使い、母集団は正規分布と仮定せよ。
Solution解き方
Let’s follow a four-step process to answer this statistical question.
4段階の手順に従って、この統計的な問いに答えよう。
- State the Question: We need to determine if, at a 0.05 significance level, the average conductivity of the selected glass is greater than one. Our hypotheses will be問いを述べる:有意水準0.05で、選んだガラスの平均伝導率が1より大きいかを判断する必要がある。仮説は次のようになる:
- H0: μ ≤ 1
- Ha: μ > 1
- Plan: We are testing a sample mean without a known population standard deviation. Therefore, we need to use a Student's t-distribution. Assume the underlying population is normal.計画:母標準偏差が分からないまま標本平均を検定するので、スチューデントのt分布を使う必要がある。背景の母集団は正規分布と仮定する。
- Based on the sample of 11 data values shown above, sample mean, sample standard deviation, and test statistic are calculated as follows:上の11個のデータの標本から、標本平均、標本標準偏差、検定統計量を次のように計算する:To calculate the p-value, note that this is a right-tailed test. Then, find the area under the t-distribution to the right of the test statistic 2.014 (using 10 degrees of freedom). This area in the right tail is 0.036, and thus the p-value = 0.036.p値を計算する際は、右片側検定であることに注意する。自由度10のt分布で、検定統計量2.014より右側の曲線下の面積を求める。この右裾の面積は0.036なので、p値 = 0.036である。
- State the Conclusions: Since the p-value (p = 0.036) is less than our alpha value, we will reject the null hypothesis. It is reasonable to state that the data supports the claim that the average conductivity level is greater than one.結論を述べる:p値(p = 0.036)がαより小さいので、帰無仮説を棄却する。データは平均伝導率が1より大きいという主張を支持すると述べるのが妥当である。
Example 9.21例題 9.21
In a study of 420,019 cell phone users, 172 of the subjects developed brain cancer. Test the claim that cell phone users developed brain cancer at a greater rate than that for non-cell phone users (the rate of brain cancer for non-cell phone users is 0.0340%). Since this is a critical issue, use a 0.005 significance level. Explain why the significance level should be so low in terms of a Type I error.
携帯電話利用者420,019人の研究で、172人が脳がんを発症した。携帯電話利用者の脳がん発症率は非利用者より高いという主張を検定せよ(非利用者の発症率は0.0340%)。重要な問題なので、有意水準0.005を使う。第1種の過誤の観点から、有意水準をこれほど低くすべき理由を説明せよ。
Solution解き方
We will follow the four-step process.
4段階の手順に従う。
- We need to conduct a hypothesis test on the claimed cancer rate. Our hypotheses will be主張されたがん発症率について仮説検定する必要がある。仮説は次のとおりである:
- H0: p ≤ 0.00034
- Ha: p > 0.00034
If we commit a Type I error, we are essentially accepting a false claim. Since the claim describes cancer-causing environments, we want to minimize the chances of incorrectly identifying causes of cancer.英語のヒント
第1種の過誤を犯すと、実質的に誤った主張を受け入れることになる。主張はがんを引き起こす環境についてなので、がんの原因を誤って特定する確率をできるだけ小さくしたい。 - We will be testing a sample proportion with x = 172 and n = 420,019. The sample is sufficiently large because we have np = 420,019(0.00034) = 142.8, nq = 420,019(0.99966) = 419,876.2, two independent outcomes, and a fixed probability of success p = 0.00034. Thus we will be able to generalize our results to the population.x = 172、n = 420,019の標本比率を検定する。np = 420,019(0.00034) = 142.8、nq = 420,019(0.99966) = 419,876.2なので標本は十分大きい。また、独立な2つの結果と、固定した成功確率p = 0.00034がある。したがって、結果を母集団に一般化できる。
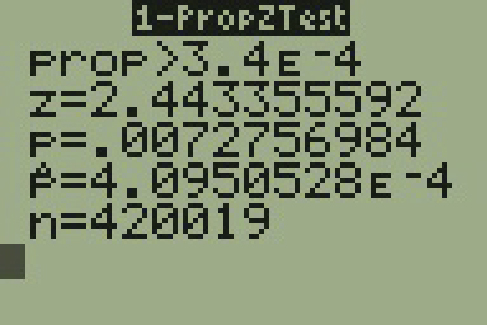
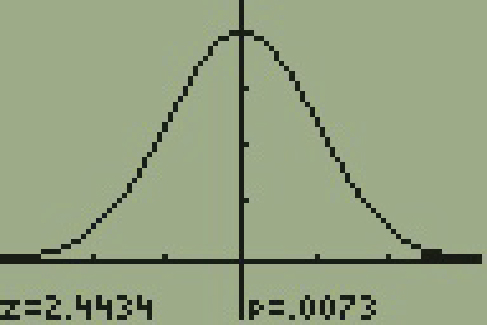
- The associated TI results are対応するTI電卓の結果は次のとおりである:Figure 9.18図 9.18Figure 9.19図 9.19
- Since the p-value = 0.0073 is greater than our alpha value = 0.005, we cannot reject the null. Therefore, we conclude that there is not enough evidence to support the claim of higher brain cancer rates for the cell phone users.p値 = 0.0073はα = 0.005より大きいので、帰無仮説を棄却できない。したがって、携帯電話利用者の脳がん発症率が高いという主張を支持する十分な証拠はないと結論づける。


Example 9.22例題 9.22
Statistical data indicates that in a certain country there are approximately 268,608,618 residents aged 12 and older. For a certain period of time, statistical data also indicates that the percentage of residents with blood type AB negative (AB-) is 207,754 individuals. This translates into a percentage of 0.078% with this rather rare blood type. In a certain province of the country, there were 11 people with blood type AB- out of the population of 37,937. Conduct an appropriate hypothesis test to determine if there is a statistically significant difference between the percentage of residents in the entire country with blood type AB- versus the percentage in the local province. Use a significance level of 0.01.
英語のヒント
統計データによると、ある国には12歳以上の住民が約268,608,618人いる。また、ある期間の統計では、AB型Rh陰性(AB−)の住民は207,754人である。この比較的珍しい血液型の割合は0.078%に相当する。同国のある州では、人口37,937人のうち11人がAB−型だった。この州と国全体でAB−型の住民の割合に統計的に有意な差があるか、適切な仮説検定を行え。有意水準0.01を使うこと。
Solution解き方
We will follow the four-step plan.
4段階の計画に従う。
- We need to test whether the proportion of residents with AB- blood type in the local province is statistically different as compared to the proportion in the entire country.州内のAB−型の住民の比率が、国全体の比率と統計的に異なるかを検定する必要がある。
- Since we are presented with proportions, we will use a one-proportion z-test. The hypotheses for the test will be:比率が与えられているので、1つの母比率のz検定を使う。検定の仮説は次のとおりである:
- Note the sample proportion is標本比率はである。The test statistic is calculated as z = -3.4189. To calculate the p-value, note that this is a two-tailed test. Find the area under the normal distribution to the left of the test statistic and then double this area. The area to the left of the test statistic is 0.000314, and this area doubled results in the p-value of 0.00063.検定統計量はz = −3.4189と計算される。p値を求める際は、両側検定であることに注意する。正規分布で検定統計量より左側の面積を求め、それを2倍にする。左側の面積は0.000314なので、2倍したp値は0.00063となる。
- Since the p-value, p = 0.00063, is less than the alpha level of 0.01, the sample data indicates that we should reject the null hypothesis. In conclusion, the sample data support the claim that the proportion of individuals with blood type AB- in the local province is different from the proportion of individuals in the entire country.p値p = 0.00063はα = 0.01より小さいので、標本データは帰無仮説を棄却すべきことを示す。結論として、州内のAB−型の人の比率が国全体の比率と異なるという主張を、標本データは支持する。