第9章1標本による仮説検定
Chapter Review章の復習
The hypothesis test itself has an established process. This can be summarized as follows:
仮説検定自体には、確立された手順がある。次のようにまとめられる:
- Determine H0 and Ha. Remember, they are contradictory.H0とHaを定める。互いに矛盾することを忘れないようにする。
- Determine the random variable.確率変数を定める。
- Determine the distribution for the test.検定に使う分布を定める。
- Draw a graph, calculate the test statistic, and use the test statistic to calculate the p-value. (A z-score and a t-score are examples of test statistics.)グラフを描き、検定統計量を計算し、それを使ってp値を計算する。(zスコアやtスコアは検定統計量の例である。)
- Compare the preconceived α with the p-value, make a decision (reject or do not reject H0), and write a clear conclusion using English sentences.事前に定めたαとp値を比較し、H0を棄却するかしないか判断して、明確な結論を英文で書く。
Notice that in performing the hypothesis test, you use α and not β. β is needed to help determine the sample size of the data that is used in calculating the p-value. Remember that the quantity 1 – β is called the Power of the Test. A high power is desirable. If the power is too low, statisticians typically increase the sample size while keeping α the same. If the power is low, the null hypothesis might not be rejected when it should be.
英語のヒント
仮説検定で使うのはβではなくαである点に注意しよう。βは、p値の計算に使うデータの標本の大きさを決める助けとなる。1 − βを検出力と呼ぶ。検出力は高いほうが望ましく、低すぎる場合、統計学者は通常αを同じに保ちながら標本を大きくする。検出力が低いと、棄却すべき帰無仮説を棄却できないことがある。
Exercises 61–73練習問題 61–73
Exercise 61問題 61
Assume H0: μ = 9 and Ha: μ < 9. Is this a left-tailed, right-tailed, or two-tailed test?
H0:μ = 9、Ha:μ < 9とする。左片側、右片側、両側のどの検定か。
Solution解き方
This is a left-tailed test.
左片側検定である。
Exercise 62問題 62
Assume H0: μ ≤ 6 and Ha: μ > 6. Is this a left-tailed, right-tailed, or two-tailed test?
H0:μ ≤ 6、Ha:μ > 6とする。左片側、右片側、両側のどの検定か。
Exercise 63問題 63
Assume H0: p = 0.25 and Ha: p ≠ 0.25. Is this a left-tailed, right-tailed, or two-tailed test?
H0:p = 0.25、Ha:p ≠ 0.25とする。左片側、右片側、両側のどの検定か。
Solution解き方
This is a two-tailed test.
両側検定である。
Exercise 64問題 64
Draw the general graph of a left-tailed test.
左片側検定の一般的なグラフを描け。
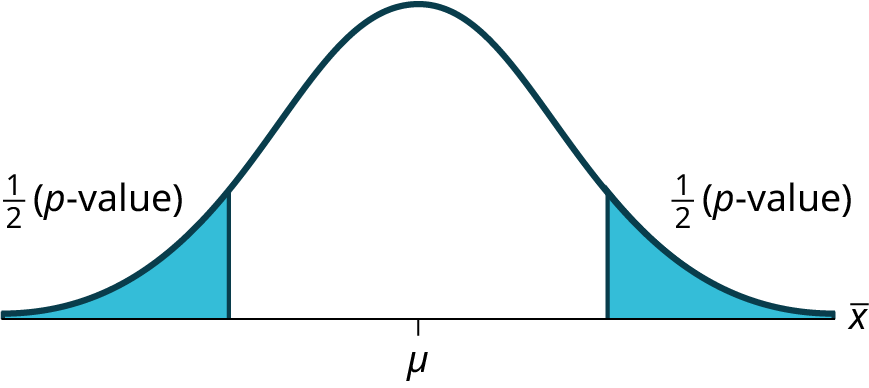
Exercise 65問題 65
Draw the graph of a two-tailed test.
両側検定のグラフを描け。

Exercise 66問題 66
A bottle of water is labeled as containing 16 fluid ounces of water. You believe it is less than that. What type of test would you use?
水のボトルに16液量オンス入りと書かれている。実際はそれより少ないと考えている。どの種類の検定を使うか。
Exercise 67問題 67
Your friend claims that his mean golf score is 63. You want to show that it is higher than that. What type of test would you use?
友人は自分のゴルフの平均スコアは63だと主張する。あなたはそれより高いことを示したい。どの種類の検定を使うか。
Solution解き方
a right-tailed test
右片側検定。
Exercise 68問題 68
A bathroom scale claims to be able to identify correctly any weight within a pound. You think that it cannot be that accurate. What type of test would you use?
体重計は、どの体重も1ポンド以内の誤差で正しく測れるとされている。あなたは、それほど正確ではないと考えている。どの種類の検定を使うか。
Exercise 69問題 69
You flip a coin and record whether it shows heads or tails. You know the probability of getting heads is 50%, but you think it is less for this particular coin. What type of test would you use?
コインを投げ、表か裏かを記録する。表の確率は50%と分かっているが、このコインではもっと低いと考えている。どの種類の検定を使うか。
Solution解き方
a left-tailed test
左片側検定
Exercise 70問題 70
If the alternative hypothesis has a not equals ( ≠ ) symbol, you know to use which type of test?
対立仮説に不等号(≠)がある場合、どの種類の検定を用いればよいか。
Exercise 71問題 71
Assume the null hypothesis states that the mean is at least 18. Is this a left-tailed, right-tailed, or two-tailed test?
帰無仮説が平均は18以上であると述べているとする。これは左片側検定、右片側検定、両側検定のどれか。
Solution解き方
This is a left-tailed test.
左片側検定である。
Exercise 72問題 72
Assume the null hypothesis states that the mean is at most 12. Is this a left-tailed, right-tailed, or two-tailed test?
帰無仮説が平均は12以下であると述べているとする。これは左片側検定、右片側検定、両側検定のどれか。
Exercise 73問題 73
Assume the null hypothesis states that the mean is equal to 88. The alternative hypothesis states that the mean is not equal to 88. Is this a left-tailed, right-tailed, or two-tailed test?
帰無仮説は平均が88に等しいと述べている。対立仮説は平均が88に等しくないと述べている。これは左片側検定、右片側検定、両側検定のどれか。
Solution解き方
This is a two-tailed test.
両側検定である。
Homework宿題
Exercises 74–87練習問題 74–87
For each of the word problems, use a solution sheet to do the hypothesis test. The solution sheet is found in Solution Sheets. Please feel free to make copies of the solution sheets. For the online version of the book, it is suggested that you copy the .doc or the .pdf files.
各文章題について、解答用紙を使って仮説検定を行え。解答用紙は「解答用紙」に掲載されている。自由に複写してよい。本書のオンライン版では、.docファイルまたは.pdfファイルをコピーするとよい。
Exercise 74問題 74
A particular brand of tires claims that its deluxe tire averages at least 50,000 miles before it needs to be replaced. From past studies of this tire, the standard deviation is known to be 8,000. A survey of owners of that tire design is conducted. From the 28 tires surveyed, the mean lifespan was 46,500 miles with a standard deviation of 9,800 miles. Using alpha = 0.05, is the data highly inconsistent with the claim?
英語のヒント
あるタイヤメーカーは、高級タイヤの交換が必要になるまでの走行距離が平均で少なくとも50,000マイルあると主張している。過去の研究から、このタイヤの標準偏差は8,000であるとわかっている。この型のタイヤの所有者を調査した。調べた28本のタイヤでは、寿命の平均は46,500マイル、標準偏差は9,800マイルだった。α = 0.05として、このデータは主張と大きく食い違っているか。
Solution解き方
- H0: μ ≥ 50,000
- Ha: μ < 50,000
- Let = the average lifespan of a brand of tires.= ある銘柄のタイヤの平均寿命とする。
- normal distribution正規分布
- z = -2.315
- p-value = 0.0103p値 = 0.0103
- Answers may vary.解答はさまざまである。
- alpha: 0.05α:0.05
- Decision: Reject the null hypothesis.判断:帰無仮説を棄却する。
- Reason for decision: The p-value is less than 0.05.判断の理由:p値が0.05より小さい。
- Conclusion: There is sufficient evidence to conclude that the mean lifespan of the tires is less than 50,000 miles.結論:タイヤの母平均寿命は50,000マイル未満であると結論づける十分な証拠がある。
- (43,537, 49,463)
Exercise 75問題 75
From generation to generation, the mean age when smokers first start to smoke varies. However, the standard deviation of that age remains constant of around 2.1 years. A survey of 40 smokers of this generation was done to see if the mean starting age is at least 19. The sample mean was 18.1 with a sample standard deviation of 1.3. Do the data support the claim at the 5% level?
喫煙者が初めて喫煙する平均年齢は世代によって異なる。しかし、その年齢の標準偏差は約2.1年で一定している。この世代の喫煙開始年齢の平均が少なくとも19歳であるかどうかを調べるため、喫煙者40人を調査した。標本平均は18.1歳、標本標準偏差は1.3歳だった。5%水準で、データはこの主張を支持するか。
Exercise 76問題 76
The cost of a daily newspaper varies from city to city. However, the variation among prices remains steady with a standard deviation of 20¢. A study was done to test the claim that the mean cost of a daily newspaper is $1.00. Twelve costs yield a mean cost of 95¢ with a standard deviation of 18¢. Do the data support the claim at the 1% level?
英語のヒント
日刊紙の価格は都市によって異なる。しかし、価格のばらつきは安定しており、標準偏差は20セントである。日刊紙の平均価格は1.00ドルであるという主張を検定する調査が行われた。12件の価格の平均は95セント、標準偏差は18セントだった。1%水準で、データはこの主張を支持するか。
Solution解き方
- H0: μ = $1.00
- Ha: μ ≠ $1.00
- Let = the average cost of a daily newspaper.= 日刊紙の平均価格とする。
- normal distribution正規分布
- z = –0.866
- p-value = 0.3865p値 = 0.3865
- Answers may vary.解答はさまざまである。
- Alpha: 0.01α:0.01
- Decision: Do not reject the null hypothesis.判断:帰無仮説を棄却しない。
- Reason for decision: The p-value is greater than 0.01.判断の理由:p値は0.01より大きい。
- Conclusion: There is sufficient evidence to support the claim that the mean cost of daily papers is $1. The mean cost could be $1.結論:日刊紙の平均価格が1ドルであるという主張を支持する十分な証拠がある。平均価格は1ドルでありうる。
- ($0.84, $1.06)
Exercise 77問題 77
An article in the San Jose Mercury News stated that students in the California state university system take 4.5 years, on average, to finish their undergraduate degrees. Suppose you believe that the mean time is longer. You conduct a survey of 49 students and obtain a sample mean of 5.1 with a sample standard deviation of 1.2. Do the data support your claim at the 1% level?
英語のヒント
『サンノゼ・マーキュリー・ニュース』の記事によると、カリフォルニア州立大学システムの学生は、学士号取得まで平均4.5年かかる。平均所要時間はそれより長いとあなたが考えているとする。学生49人を調査すると、標本平均は5.1年、標本標準偏差は1.2年だった。1%水準で、データはあなたの主張を支持するか。
Exercise 78問題 78
The mean number of sick days an employee takes per year is believed to be about ten. Members of a personnel department do not believe this figure. They randomly survey eight employees. The number of sick days they took for the past year are as follows: 12; 4; 15; 3; 11; 8; 6; 8. Let x = the number of sick days they took for the past year. Should the personnel team believe that the mean number is ten?
英語のヒント
従業員が1年間に取得する病気休暇は平均約10日だと考えられている。人事部の職員はこの数字を信じていない。無作為に選んだ従業員8人を調査した。過去1年間に取得した病気休暇の日数は、12、4、15、3、11、8、6、8だった。x = 過去1年間に取得した病気休暇の日数とする。人事部は平均日数が10日だと考えるべきか。
Solution解き方
- H0: μ = 10
- Ha: μ ≠ 10
- Let the mean number of sick days an employee takes per year.を、従業員が1年間に取得する病気休暇の平均日数とする。
- Student’s t-distributionスチューデントのt分布
- t = –1.13
- p-value = 0.1299p値 = 0.1299
- Answers may vary.解答はさまざまである。
- Alpha: 0.05α:0.05
- Decision: Do not reject the null hypothesis.判断:帰無仮説を棄却しない。
- Reason for decision: The p-value is greater than 0.05.判断の理由:p値が0.05より大きい。
- Conclusion: At the 5% significance level, there is insufficient evidence to conclude that the mean number of sick days is not ten.結論:有意水準5%では、病気休暇の平均日数が10日ではないと結論づける証拠は不十分である。
- (4.9443, 11.806)
Exercise 79問題 79
In 1955, Life Magazine reported that the 25 year-old mother of three worked, on average, an 80 hour week. Recently, many groups have been studying whether or not the women's movement has, in fact, resulted in an increase in the average work week for women (combining employment and at-home work). Suppose a study was done to determine if the mean work week has increased. 81 women were surveyed with the following results. The sample mean was 83; the sample standard deviation was ten. Does it appear that the mean work week has increased for women at the 5% level?
1955年に『ライフ』誌は、子どもが3人いる25歳の母親は平均で週80時間働いていると報じた。近年、多くの団体が、女性運動によって女性の1週間の平均労働時間(雇用労働と家庭内の労働の合計)が実際に増えたかどうかを研究している。週平均労働時間が増えたかどうかを調べる研究を行ったとする。81人の女性を調査し、標本平均83時間、標本標準偏差10時間という結果を得た。5%水準で、女性の週平均労働時間は増加したといえるか。
Exercise 80問題 80
Your statistics instructor claims that 60% of the students who take their Elementary Statistics class go through life feeling more enriched. For some reason that the instructor can't quite figure out, most people don't believe her. You decide to check this out on your own. You randomly survey 64 of their past Elementary Statistics students and find that 34 feel more enriched as a result of taking the class. Now, what do you think?
英語のヒント
統計学の教員は、自分の「初等統計学」を受講した学生の60%が、人生がより充実したと感じながら生きていると主張する。教員にはどうにもわからない理由で、ほとんどの人はその話を信じない。そこで自分で調べることにした。過去の受講者64人を無作為に調査すると、34人が受講によって人生がより充実したと感じていた。さて、あなたはどう考えるか。
Solution解き方
- H0: p ≥ 0.6
- Ha: p < 0.6
- Let P′ = the proportion of students who feel more enriched as a result of taking Elementary Statistics.P′ = 初等統計学を受講した結果、人生がより充実したと感じる学生の割合とする。
- normal for a single proportion1つの比率に対する正規分布
- 1.13
- p-value = 0.1299p値 = 0.1299
- Answers may vary.解答はさまざまである。
- Alpha: 0.05α:0.05
- Decision: Do not reject the null hypothesis.判断:帰無仮説を棄却しない。
- Reason for decision: The p-value is greater than 0.05.判断の理由:p値が0.05より大きい。
- Conclusion: There is insufficient evidence to conclude that less than 60 percent of the students feel more enriched.結論:人生がより充実したと感じる学生の割合は60%未満であると結論づける証拠は不十分である。
- Confidence Interval: (0.409, 0.654)
The “plus-4s” confidence interval is (0.411, 0.648)信頼区間:(0.409, 0.654)。「プラス4」信頼区間は(0.411, 0.648)である。
Exercise 81問題 81
A Nissan Motor Corporation advertisement read, “The average man’s I.Q. is 107. The average brown trout’s I.Q. is 4. So why can’t man catch brown trout?” Suppose you believe that the brown trout’s mean I.Q. is greater than four. You catch 12 brown trout. A fish psychologist determines the I.Q.s as follows: 5; 4; 7; 3; 6; 4; 5; 3; 6; 3; 8; 5. Conduct a hypothesis test of your belief.
英語のヒント
日産自動車の広告には、「人間の平均IQは107。ブラウントラウトの平均IQは4。それなのに、なぜ人間はブラウントラウトを釣れないのか」とあった。ブラウントラウトの平均IQは4より大きいとあなたが考えているとする。12匹を釣り、魚の心理学者がIQを調べると、5、4、7、3、6、4、5、3、6、3、8、5だった。あなたの考えについて仮説検定を行え。
Exercise 82問題 82
Refer to Exercise 9.81. Conduct a hypothesis test to see if your decision and conclusion would change if your belief were that the brown trout’s mean I.Q. is not four.
演習9.81を参照せよ。ブラウントラウトの平均IQは4ではないと考えていた場合に、判断や結論が変わるかどうか、仮説検定を行え。
Solution解き方
- H0: μ = 4
- Ha: μ ≠ 4
- Let the average I.Q. of a set of brown trout.を、ブラウントラウトの集団の平均IQとする。
- two-tailed Student's t-test両側のスチューデントのt検定
- t = 1.95
- p-value = 0.076p値 = 0.076
- Check student’s solution.学生の解答を確認する。
- Alpha: 0.05α:0.05
- Decision: Reject the null hypothesis.判断:帰無仮説を棄却する。
- Reason for decision: The p-value is greater than 0.05判断の理由:p値は0.05より大きい。
- Conclusion: There is insufficient evidence to conclude that the average IQ of brown trout is not four.結論:ブラウントラウトの平均IQは4ではないと結論づける証拠は不十分である。
- (3.8865,5.9468)
Exercise 83問題 83
According to an article in Newsweek, the birth ratio of females to males is 100:105. In China, the birth ratio is 100: 114 (46.7% females). Suppose you want to explore the reported figures of the percent of females born in China. You conduct a study. In this study, you count the number of females and males born in 150 randomly chosen recent births. There are 60 females and 90 males born of the 150. Based on your study, do you believe that the percent of females born in China is 46.7?
『ニューズウィーク』の記事によると、出生数の女児対男児の比は100:105である。中国では100:114(女児46.7%)である。報告された中国の女児出生割合を調べたいとする。最近の出生から無作為に150件を選び、女児と男児の人数を数えた。150人中、女児は60人、男児は90人だった。この調査に基づき、中国で生まれる子どものうち女児の割合は46.7%だと考えるか。
Exercise 84問題 84
A poll done for Newsweek found that 13% of Americans have seen or sensed the presence of an angel. A contingent doubts that the percent is really that high. It conducts its own survey. Out of 76 Americans surveyed, only two had seen or sensed the presence of an angel. As a result of the contingent’s survey, would you agree with the Newsweek poll? In complete sentences, also give three reasons why the two polls might give different results.
英語のヒント
『ニューズウィーク』のために行われた世論調査では、米国人の13%が天使を見た、またはその存在を感じたことがあると答えた。ある一団は、その割合が本当にそれほど高いのか疑い、独自の調査を行った。調査した米国人76人のうち、天使を見たり存在を感じたりしたことがあるのは2人だけだった。この一団の調査結果を踏まえて、『ニューズウィーク』の調査に同意するか。また、2つの調査で異なる結果が出た理由を3つ、完結した文で述べよ。
Solution解き方
- H0: p ≥ 0.13
- Ha: p < 0.13
- Let P′ = the proportion of Americans who have seen or sensed angelsP′ = 天使を見た、または存在を感じたことがある米国人の割合とする。
- normal for a single proportion1つの比率に対する正規分布
- –2.688
- p-value = 0.0036p値 = 0.0036
- Check student’s solution.学生の解答を確認する。
- alpha: 0.05α:0.05
- Decision: Reject the null hypothesis.判断:帰無仮説を棄却する。
- Reason for decision: The p-value is less than 0.05.判断の理由:p値が0.05より小さい。
- Conclusion: There is sufficient evidence to conclude that the percentage of Americans who have seen or sensed an angel is less than 13%.結論:天使を見た、または存在を感じたことがある米国人の割合は13%未満であると結論づける十分な証拠がある。
- (0, 0.0623).
The“plus-4s” confidence interval is (0.0022, 0.0978)(0, 0.0623)。「プラス4」信頼区間は(0.0022, 0.0978)である。
Exercise 85問題 85
The mean work week for engineers in a start-up company is believed to be about 60 hours. A newly hired engineer hopes that it’s shorter. They ask ten engineering friends in start-ups for the lengths of their mean work weeks. Based on the results that follow, should the engineer count on the mean work week to be shorter than 60 hours?
英語のヒント
新興企業の技術者の週平均労働時間は約60時間だと考えられている。新たに採用された技術者は、もっと短いことを望んでいる。新興企業で働く技術者の友人10人に、週平均労働時間を尋ねた。以下の結果から、この技術者は週平均労働時間が60時間未満だと期待してよいか。
Data (length of mean work week): 70; 45; 55; 60; 65; 55; 55; 60; 50; 55.
データ(週平均労働時間):70、45、55、60、65、55、55、60、50、55。
Exercise 86問題 86
Solution解き方
- H0: μ ≥ 129
- Ha: μ < 129
- Let = the average time in seconds that Terri finishes Lap 4.= テリが第4周を走り終える平均時間(秒)とする。
- Student's t-distributionスチューデントのt分布
- t = 1.209
- 0.8792
- Check student’s solution.学生の解答を確認する。
- Alpha: 0.05α:0.05
- Decision: Do not reject the null hypothesis.判断:帰無仮説を棄却しない。
- Reason for decision: The p-value is greater than 0.05.判断の理由:p値が0.05より大きい。
- Conclusion: There is insufficient evidence to conclude that Terri’s mean lap time is less than 129 seconds.結論:テリの平均ラップタイムは129秒未満であると結論づける証拠は不十分である。
- (128.63, 130.37)
Exercise 87問題 87