第1章標本抽出とデータ
1.2 Data, Sampling, and Variation in Data and Sampling1.2 データ、標本抽出、およびそれらのばらつき
Data may come from a population or from a sample. Lowercase letters like or generally are used to represent data values. Most data can be put into the following categories:
英語のヒント
データは母集団から得られる場合も、標本から得られる場合もある。データの値は一般に、やのような小文字で表す。多くのデータは、次の区分に分けられる。
- Qualitative質的
- Quantitative量的
Qualitative data are the result of categorizing or describing attributes of a population. Qualitative data are also often called categorical data. Hair color, blood type, ethnic group, the car a person drives, and the street a person lives on are examples of qualitative data. Qualitative data are generally described by words or letters. For instance, hair color might be black, dark brown, light brown, blonde, gray, or red. Blood type might be AB+, O-, or B+. Researchers often prefer to use quantitative data over qualitative data because it lends itself more easily to mathematical analysis. For example, it does not make sense to find an average hair color or blood type.
英語のヒント
質的データは、母集団の属性を分類したり記述したりした結果である。カテゴリデータともよく呼ばれる。髪の色、血液型、民族集団、乗っている車、住んでいる通りなどが例である。質的データは一般に、言葉や文字で表す。例えば髪の色なら、黒、濃い茶色、薄い茶色、金髪、灰色、赤毛などがある。血液型なら、AB+、O−、B+などがある。研究者は、数学的な分析をしやすいので、質的データより量的データを使いたいと考えることが多い。例えば、髪の色や血液型の平均を求めても意味はない。
Quantitative data are always numbers. Quantitative data are the result of counting or measuring attributes of a population. Amount of money, pulse rate, weight, number of people living in your town, and number of students who take statistics are examples of quantitative data. Quantitative data may be either discrete or continuous.
英語のヒント
量的データは常に数値である。母集団の属性を数えたり測定したりした結果である。金額、脈拍数、体重、町に住む人数、統計を受講する学生数などが例となる。量的データには、離散と連続のいずれもある。
All data that are the result of counting are called quantitative discrete data. These data take on only certain numerical values. If you count the number of phone calls you receive for each day of the week, you might get values such as zero, one, two, or three.
数えることで得られたデータを、量的離散データという。このデータは、特定の数値だけを取る。1週間の各日に受けた電話の本数を数えると、0、1、2、3などの値が得られるだろう。
Data that are not only made up of counting numbers, but that may include fractions, decimals, or irrational numbers, are called quantitative continuous data. Continuous data are often the results of measurements like lengths, weights, or times. A list of the lengths in minutes for all the phone calls that you make in a week, with numbers like 2.4, 7.5, or 11.0, would be quantitative continuous data.
英語のヒント
数えるための整数だけでなく、分数、小数、無理数を含むこともあるデータを、量的連続データという。連続データは、長さ、重さ、時間などを測定した結果であることが多い。1週間にかけたすべての電話について、通話時間を分単位で並べたものは、2.4、7.5、11.0などの数値になり、量的連続データである。
Example 1.5例題 1.5
Data Sample of Quantitative Discrete Data量的離散データの標本
The data are the number of books students carry in their backpacks. You sample five students. Two students carry three books, one student carries four books, one student carries two books, and one student carries one book. The numbers of books (three, four, two, and one) are the quantitative discrete data.
データは、学生がリュックに入れて持ち歩く本の冊数である。学生5人を標本に選ぶ。2人は3冊、1人は4冊、1人は2冊、1人は1冊持っている。本の冊数(3、4、2、1)は、量的離散データである。
Example 1.6例題 1.6
Data Sample of Quantitative Continuous Data量的連続データの標本
The data are the weights of backpacks with books in them. You sample the same five students. The weights (in pounds) of their backpacks are 6.2, 7, 6.8, 9.1, 4.3. Notice that backpacks carrying three books can have different weights. Weights are quantitative continuous data.
データは、本を入れたリュックの重さである。同じ5人の学生を標本に選ぶ。リュックの重さはポンド単位で6.2、7、6.8、9.1、4.3である。本が3冊入ったリュック同士でも、重さは異なりうることに注意しよう。重さは量的連続データである。
Example 1.7例題 1.7
You go to the supermarket and purchase three cans of soup (19 ounces tomato bisque, 14.1 ounces lentil, and 19 ounces Italian wedding), two packages of nuts (walnuts and peanuts), four different kinds of vegetable (broccoli, cauliflower, spinach, and carrots), and two desserts (16 ounces pistachio ice cream and 32 ounces chocolate chip cookies).
英語のヒント
スーパーマーケットで、スープの缶詰を3缶(トマトビスク19オンス、レンズ豆14.1オンス、イタリアンウェディングスープ19オンス)、ナッツを2袋(クルミとピーナッツ)、野菜を4種類(ブロッコリー、カリフラワー、ホウレンソウ、ニンジン)買う。さらに、デザートを2種類(ピスタチオアイスクリーム16オンス、チョコチップクッキー32オンス)買う。
Name data sets that are quantitative discrete, quantitative continuous, and qualitative.
量的離散データ、量的連続データ、質的データとなるデータの集まりを挙げよ。
Solution解き方
One Possible Solution:
解答例:
- The three cans of soup, two packages of nuts, four kinds of vegetables and two desserts are quantitative discrete data because you count them.スープ3缶、ナッツ2袋、野菜4種類、デザート2種類は、数えることで得られるので、量的離散データである。
- The weights of the soups (19 ounces, 14.1 ounces, 19 ounces) are quantitative continuous data because you measure weights as precisely as possible.
英語のヒント
スープの重さ(19オンス、14.1オンス、19オンス)は、可能な限り正確に重さを測定するので、量的連続データである。 - Types of soups, nuts, vegetables and desserts are qualitative data because they are categorical.スープ、ナッツ、野菜、デザートの種類は、カテゴリに当たるので、質的データである。
Try to identify additional data sets in this example.
この例の中で、ほかにもデータの集まりを挙げてみよう。
Example 1.8例題 1.8
The data are the colors of backpacks. Again, you sample the same five students. One student has a red backpack, two students have black backpacks, one student has a green backpack, and one student has a gray backpack. The colors red, black, black, green, and gray are qualitative data.
データはリュックの色である。再び、同じ5人の学生を標本に選ぶ。1人は赤、2人は黒、1人は緑、1人は灰色のリュックを持っている。赤、黒、黒、緑、灰色という色は、質的データである。
Example 1.9例題 1.9
Work collaboratively to determine the correct data type (quantitative or qualitative). Indicate whether quantitative data are continuous or discrete. Hint: Data that are discrete often start with the words "the number of."
協力して、正しいデータの種類(量的か質的か)を答えよ。量的データなら、連続か離散かも示す。ヒント:離散データは、「〜の数」という言葉で始まることが多い。
- the number of pairs of shoes you own持っている靴の足数
- the type of car you drive運転している車の種類
- the distance it is from your home to the nearest grocery store自宅から最寄りの食料品店までの距離
- the number of classes you take per school year.1学年に受講する授業の数
- the type of calculator you use使用する計算機の種類
- weights of dogs at an animal shelter動物保護施設にいる犬の重さ
- number of correct answers on a quiz小テストの正答数
- IQ scores (This may cause some discussion.)IQの得点(これについては議論になるかもしれない)
Solution解き方
Items a, d, and g are quantitative discrete; items c, f, and h are quantitative continuous; items b and e are qualitative, or categorical.
a、d、gは量的離散データ、c、f、hは量的連続データ、b、eは質的、つまりカテゴリデータである。
Example 1.10例題 1.10
A statistics professor collects information about the classification of her students as first-year students, sophomores, juniors, or seniors. The data she collects are summarized in the pie chart Figure 1.3. What type of data does this graph show?
英語のヒント
統計の教員が、学生が1年生、2年生、3年生、4年生のどれに当たるかという情報を集めた。集めたデータを図1.3の円グラフにまとめた。このグラフは、どの種類のデータを示しているか。
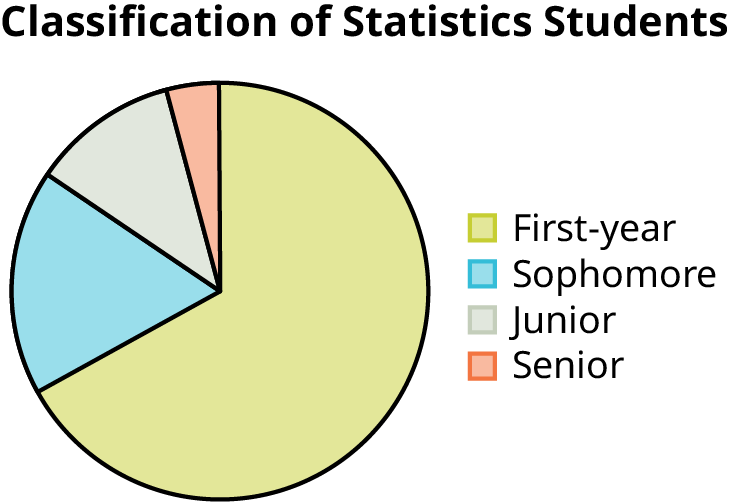

Figure 1.3図 1.3
Solution解き方
This pie chart shows the students in each year, which is qualitative (or categorical) data.
この円グラフは各学年の学生を示しており、質的(カテゴリ)データである。