第1章標本抽出とデータ
References参考文献
“State & County QuickFacts,” U.S. Census Bureau. http://quickfacts.census.gov/qfd/download_data.html (accessed May 1, 2013).
「州・郡の基本統計」、米国国勢調査局。http://quickfacts.census.gov/qfd/download_data.html(2013年5月1日閲覧)。
“State & County QuickFacts: Quick, easy access to facts about people, business, and geography,” U.S. Census Bureau. http://quickfacts.census.gov/qfd/index.html (accessed May 1, 2013).
「州・郡の基本統計:人口・事業・地理に関する情報への迅速で簡単なアクセス」、米国国勢調査局。http://quickfacts.census.gov/qfd/index.html(2013年5月1日閲覧)。
“Table 5: Direct hits by mainland United States Hurricanes (1851-2004),” National Hurricane Center, http://www.nhc.noaa.gov/gifs/table5.gif (accessed May 1, 2013).
「表5:米国本土を直撃したハリケーン(1851~2004年)」、国立ハリケーンセンター。http://www.nhc.noaa.gov/gifs/table5.gif(2013年5月1日閲覧)。
“Levels of Measurement,” http://infinity.cos.edu/faculty/woodbury/stats/tutorial/Data_Levels.htm (accessed May 1, 2013).
「測定尺度」、http://infinity.cos.edu/faculty/woodbury/stats/tutorial/Data_Levels.htm(2013年5月1日閲覧)。
Courtney Taylor, “Levels of Measurement,” about.com, http://statistics.about.com/od/HelpandTutorials/a/Levels-Of-Measurement.htm (accessed May 1, 2013).
Courtney Taylor「測定尺度」、about.com。http://statistics.about.com/od/HelpandTutorials/a/Levels-Of-Measurement.htm(2013年5月1日閲覧)。
David Lane. “Levels of Measurement,” Connexions, http://cnx.org/content/m10809/latest/ (accessed May 1, 2013).
David Lane「測定尺度」、Connexions。http://cnx.org/content/m10809/latest/(2013年5月1日閲覧)。
Chapter Review章の復習
Some calculations generate numbers that are artificially precise. It is not necessary to report a value to eight decimal places when the measures that generated that value were only accurate to the nearest tenth. Round off your final answer to one more decimal place than was present in the original data. This means that if you have data measured to the nearest tenth of a unit, report the final statistic to the nearest hundredth.
英語のヒント
計算によって、見かけだけ精密な数値が得られることがある。元の測定値が小数第1位までしか正確でないのに、結果を小数第8位まで示す必要はない。最終的な答えは、元のデータより小数点以下を1桁多く残して丸める。つまり、単位の小数第1位まで測定したデータなら、最終的な統計量は小数第2位まで示す。
In addition to rounding your answers, you can measure your data using the following four levels of measurement.
答えの丸め方に加えて、データの測定には次の4種類の測定尺度がある。
- Nominal scale level: data that cannot be ordered nor can it be used in calculations名義尺度:順序を付けられず、計算にも使えないデータ。
- Ordinal scale level: data that can be ordered; the differences cannot be measured順序尺度:順序は付けられるが、差を測れないデータ。
- Interval scale level: data with a definite ordering but no starting point; the differences can be measured, but there is no such thing as a ratio.間隔尺度:明確な順序はあるが起点がないデータ。差は測れるが、比率というものはない。
- Ratio scale level: data with a starting point that can be ordered; the differences have meaning and ratios can be calculated.比率尺度:起点があり、順序を付けられるデータ。差に意味があり、比率を計算できる。
When organizing data, it is important to know how many times a value appears. How many statistics students study five hours or more for an exam? What percent of families on our block own two pets? Frequency, relative frequency, and cumulative relative frequency are measures that answer questions like these.
データを整理するときは、ある値が何回現れるかを知ることが重要である。試験のために5時間以上勉強する統計学の学生は何人か。近所の世帯の何%がペットを2匹飼っているか。度数、相対度数、累積相対度数は、このような問いに答える指標である。
Exercises 79練習問題 79
Exercise 79問題 79
What type of measure scale is being used? Nominal, ordinal, interval or ratio.
どの測定尺度が使われているか。名義尺度、順序尺度、間隔尺度、比率尺度から選べ。
- High school soccer players classified by their athletic ability: Superior, Average, Above average高校のサッカー選手を運動能力で分類したもの:優秀、平均、平均より上
- Baking temperatures for various main dishes: 350, 400, 325, 250, 300さまざまな主菜を焼く温度:350、400、325、250、300
- The colors of crayons in a 24-crayon box24色入りの箱に入っているクレヨンの色
- Social security numbers社会保障番号
- Incomes measured in dollarsドルで測った所得
- A satisfaction survey of a social website by number: 1 = very satisfied, 2 = somewhat satisfied, 3 = not satisfiedソーシャルサイトの満足度を数値で調査したもの:1=とても満足、2=やや満足、3=満足していない
- Political outlook: extreme left, left-of-center, right-of-center, extreme right政治的立場:極左、中道左派、中道右派、極右
- Time of day on an analog watchアナログ時計が示す時刻
- The distance in miles to the closest grocery store最寄りの食料品店までの距離(マイル)
- The dates 1066, 1492, 1644, 1947, and 19441066年、1492年、1644年、1947年、1944年という年代
- The heights of 21–65 year-old women21~65歳の女性の身長
- Common letter grades: A, B, C, D, and F一般的な成績評価:A、B、C、D、F
Solution解き方
- ordinal順序尺度
- interval間隔尺度
- nominal名義尺度
- nominal名義尺度
- ratio比率尺度
- ordinal順序尺度
- nominal名義尺度
- interval間隔尺度
- ratio比率尺度
- interval間隔尺度
- ratio比率尺度
- ordinal順序尺度
HOMEWORK宿題
Exercises 80–84練習問題 80–84
Exercise 80問題 80
Fifty part-time students were asked how many courses they were taking this term. The (incomplete) results are shown below:
パートタイム学生50人に、今学期に履修している科目数を尋ねた。(未完成の)結果を以下に示す。
# of Courses 科目数 |
Frequency 度数 |
Relative Frequency 相対度数 |
Cumulative Relative Frequency 累積相対度数 |
|---|---|---|---|
1 |
30 |
0.6 |
|
2 |
15 |
||
3 |
- Fill in the blanks in Table 1.26.表1.26の空欄を埋めよ。
- What percent of students take exactly two courses?ちょうど2科目を履修している学生は何%か。
- What percent of students take one or two courses?1科目または2科目を履修している学生は何%か。
Exercise 81問題 81
Sixty adults with gum disease were asked the number of times per week they used to floss before their diagnosis. The (incomplete) results are shown in Table 1.27.
英語のヒント
歯周病の成人60人に、診断前は週に何回デンタルフロスを使っていたかを尋ねた。(未完成の)結果を表1.27に示す。
# Flossing per Week 週当たりのフロス使用回数 |
Frequency 度数 |
Relative Frequency 相対度数 |
Cumulative Relative Freq. 累積相対度数 |
|---|---|---|---|
0 |
27 |
0.4500 |
|
1 |
18 |
||
3 |
0.9333 |
||
6 |
3 |
0.0500 |
|
7 |
1 |
0.0167 |
- Fill in the blanks in Table 1.27.表1.27の空欄を埋めよ。
- What percent of adults flossed six times per week?週に6回フロスを使っていた成人は何%か。
- What percent flossed at most three times per week?週に3回以下しかフロスを使っていなかった人は何%か。
Solution解き方
- # Flossing per Week週当たりのフロス使用回数Frequency度数Relative Frequency相対度数Cumulative Relative Frequency累積相対度数0270.45000.45001180.30000.75003110.18330.9333630.05000.9833710.01671Table 1.28表 1.28
- 5.00%
- 93.33%
Exercise 82問題 82
Nineteen immigrants to the U.S were asked how many years, to the nearest year, they have lived in the U.S. The data are as follows:
米国への移民19人に、米国で暮らしてきた年数を1年単位に丸めて尋ねた。データは次のとおりである。
- 2
- 5
- 7
- 2
- 2
- 10
- 20
- 15
- 0
- 7
- 0
- 20
- 5
- 12
- 15
- 12
- 4
- 5
- 10
.
Table 1.29 was produced.
表1.29が作成された。
Data データ |
Frequency 度数 |
Relative Frequency 相対度数 |
Cumulative Relative Frequency 累積相対度数 |
|---|---|---|---|
0 |
2 |
0.1053 |
|
2 |
3 |
0.2632 |
|
4 |
1 |
0.3158 |
|
5 |
3 |
0.4737 |
|
7 |
2 |
0.5789 |
|
10 |
2 |
0.6842 |
|
12 |
2 |
0.7895 |
|
15 |
1 |
0.8421 |
|
20 |
1 |
1.0000 |
- Fix the errors in Table 1.29. Also, explain how someone might have arrived at the incorrect number(s).表1.29の誤りを直せ。また、どのようにして誤った数値に至った可能性があるか説明せよ。
- Explain what is wrong with this statement: “47 percent of the people surveyed have lived in the U.S. for 5 years.”「調査対象者の47%は米国に5年間暮らしている」という記述のどこが誤っているか説明せよ。
- Fix the statement in b to make it correct.bの記述を正しく書き直せ。
- What fraction of the people surveyed have lived in the U.S. five or seven years?調査対象者のうち、米国に5年または7年暮らしている人の割合はいくつか。
- What fraction of the people surveyed have lived in the U.S. at most 12 years?調査対象者のうち、米国での居住年数が12年以下の人の割合はいくつか。
- What fraction of the people surveyed have lived in the U.S. fewer than 12 years?調査対象者のうち、米国での居住年数が12年未満の人の割合はいくつか。
- What fraction of the people surveyed have lived in the U.S. from five to 20 years, inclusive?
英語のヒント
調査対象者のうち、米国での居住年数が5年以上20年以下の人の割合はいくつか。
Exercise 83問題 83
How much time does it take to travel to work? Table 1.30 shows the mean commute time by state for workers at least 16 years old who are not working at home. Find the mean travel time, and round off the answer properly.
通勤にはどのくらい時間がかかるか。表1.30は、自宅以外で働く16歳以上の労働者について、州別の平均通勤時間を示している。通勤時間の平均を求め、答えを適切に丸めよ。
24.0 |
24.3 |
25.9 |
18.9 |
27.5 |
17.9 |
21.8 |
20.9 |
16.7 |
27.3 |
18.2 |
24.7 |
20.0 |
22.6 |
23.9 |
18.0 |
31.4 |
22.3 |
24.0 |
25.5 |
24.7 |
24.6 |
28.1 |
24.9 |
22.6 |
23.6 |
23.4 |
25.7 |
24.8 |
25.5 |
21.2 |
25.7 |
23.1 |
23.0 |
23.9 |
26.0 |
16.3 |
23.1 |
21.4 |
21.5 |
27.0 |
27.0 |
18.6 |
31.7 |
23.3 |
30.1 |
22.9 |
23.3 |
21.7 |
18.6 |
Solution解き方
The sum of the travel times is 1,173.1. Divide the sum by 50 to calculate the mean value: 23.462. Because each state’s travel time was measured to the nearest tenth, round this calculation to the nearest hundredth: 23.46.
通勤時間の合計は1,173.1である。この合計を50で割ると、平均23.462が得られる。各州の通勤時間は小数第1位まで測られているため、この計算結果を小数第2位までに丸め、23.46とする。
Exercise 84問題 84
A leading business magazine publishes data on small businesses (defined as businesses that have been publicly traded for at least a year, have a stock price of at least $5 per share, and have reported annual revenue between $5 million and $1 billion). Table 1.31 shows the ages of the chief executive officers for the first 60 ranked small businesses.
英語のヒント
ある有力なビジネス誌は、小規模企業のデータを公表している。ここでいう小規模企業とは、少なくとも1年前から株式が公開市場で取引され、1株の価格が5ドル以上で、年間売上高が500万ドルから10億ドルと報告されている企業である。表1.31は、順位の上位60社について、最高経営責任者の年齢を示したものである。
Age 年齢 |
Frequency 度数 |
Relative Frequency 相対度数 |
Cumulative Relative Frequency 累積相対度数 |
|---|---|---|---|
40–44 |
3 |
||
45–49 |
11 |
||
50–54 |
13 |
||
55–59 |
16 |
||
60–64 |
10 |
||
65–69 |
6 |
||
70–74 |
1 |
- What is the frequency for CEO ages between 54 and 65?54~65歳のCEOの度数はいくつか。
- What percentage of CEOs are 65 years or older?65歳以上のCEOは何%か。
- What is the relative frequency of ages under 50?50歳未満の年齢の相対度数はいくつか。
- What is the cumulative relative frequency for CEOs younger than 55?55歳未満のCEOの累積相対度数はいくつか。
- Which graph shows the relative frequency and which shows the cumulative relative frequency?どちらのグラフが相対度数を示し、どちらが累積相対度数を示しているか。
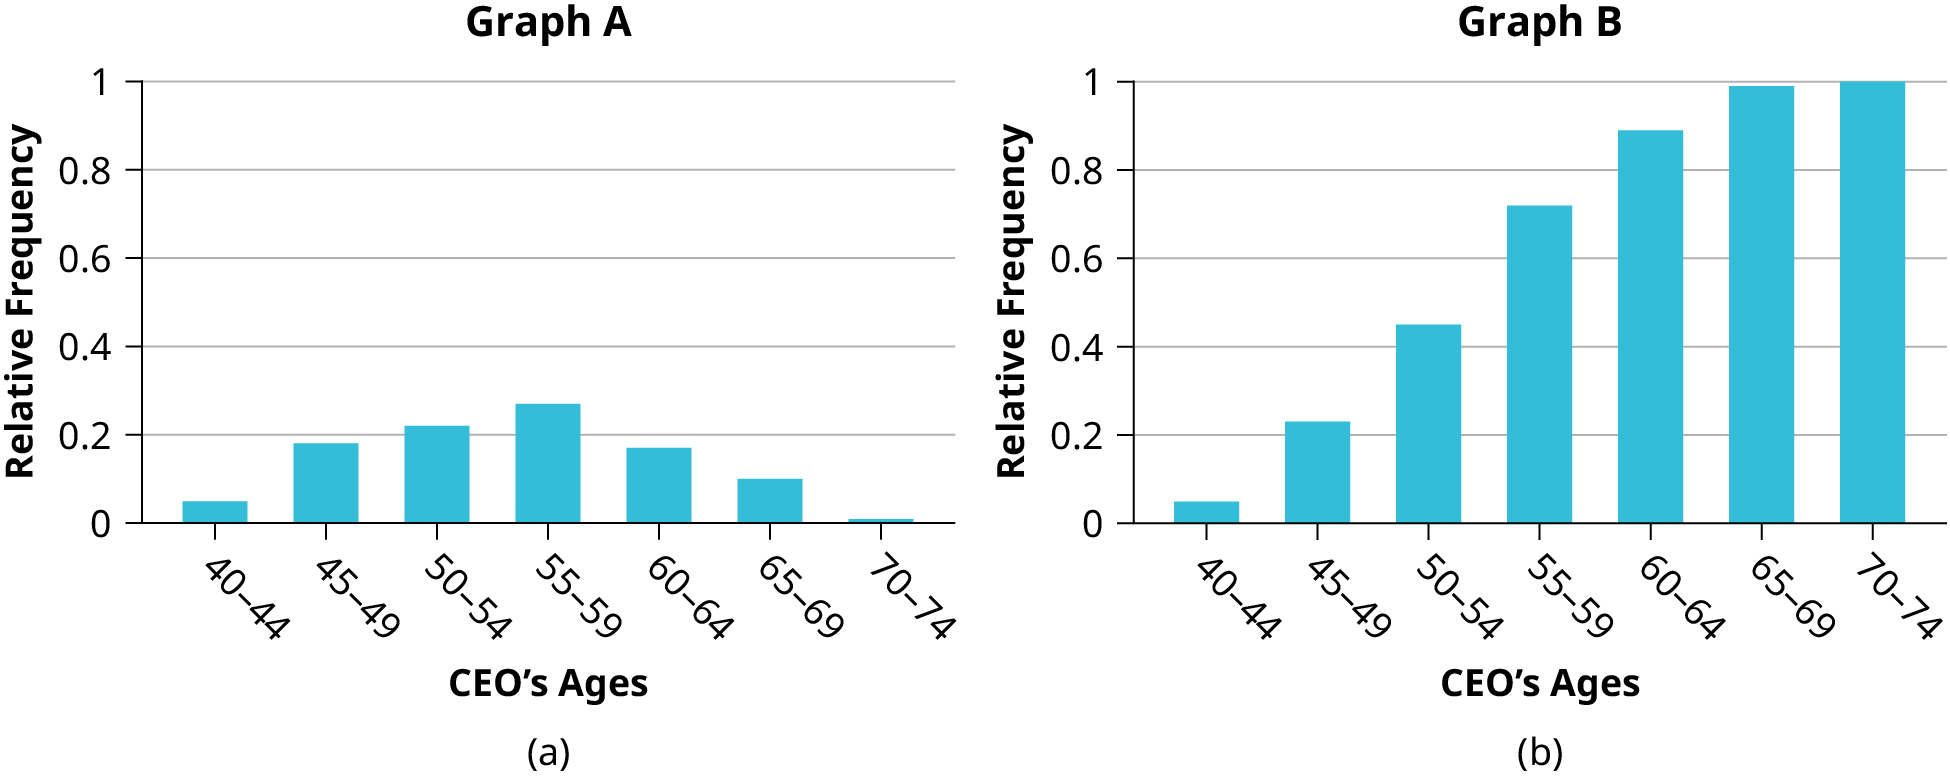

Figure 1.13図 1.13