第1章標本抽出とデータ
Qualitative Data Discussion質的データについて考える
Below are tables comparing the number of part-time and full-time students at De Anza College and Foothill College enrolled for the most recent spring quarter. The tables display counts (frequencies) and percentages or proportions (relative frequencies). The percent columns make comparing the same categories in the colleges easier. Displaying percentages along with the numbers is often helpful, but it is particularly important when comparing sets of data that do not have the same totals, such as the total enrollments for both colleges in this example. Notice how much larger the percentage for part-time students at Foothill College is compared to De Anza College.
英語のヒント
以下の表は、直近の春学期に登録したディアンザ・カレッジとフットヒル・カレッジの、パートタイム学生とフルタイム学生の人数を比較したものである。表には人数(度数)と、百分率または比率(相対度数)を示す。百分率の列があると、大学間で同じ区分を比べやすくなる。数値と一緒に百分率を示すことは、しばしば役に立つ。特に、この例の両大学の総在籍者数のように、合計が同じでないデータ同士を比べるときに重要である。フットヒル・カレッジのパートタイム学生の割合が、ディアンザ・カレッジよりどれだけ大きいかに注目しよう。
De Anza College ディアンザ・カレッジ |
Foothill College フットヒル・カレッジ |
||||
|---|---|---|---|---|---|
Number 人数 |
Percent 百分率 |
Number 人数 |
Percent 百分率 |
||
Full-time フルタイム |
9,200 |
40.9% |
Full-time フルタイム |
4,059 |
28.6% |
Part-time パートタイム |
13,296 |
59.1% |
Part-time パートタイム |
10,124 |
71.4% |
Total 合計 |
22,496 |
100% |
Total 合計 |
14,183 |
100% |
Tables are a good way of organizing and displaying data. But graphs can be even more helpful in understanding the data. There are no strict rules concerning which graphs to use. Two graphs that are used to display qualitative data are pie charts and bar graphs.
表は、データを整理して示すのに適した方法である。しかし、データを理解するには、グラフの方がさらに役立つこともある。どのグラフを使うかについて、厳密な決まりはない。質的データを示す二つのグラフとして、円グラフと棒グラフがある。
In a pie chart, categories of data are represented by wedges in a circle and are proportional in size to the percent of individuals in each category.
英語のヒント
円グラフでは、データの各カテゴリを円の扇形で表し、その大きさを各カテゴリに属する個体の百分率に比例させる。
In a bar graph, the length of the bar for each category is proportional to the number or percent of individuals in each category. Bars may be vertical or horizontal.
棒グラフでは、各カテゴリの棒の長さを、そのカテゴリに属する個体の数または百分率に比例させる。棒は縦向きでも横向きでもよい。
A Pareto chart consists of bars that are sorted into order by category size (largest to smallest).
英語のヒント
パレート図は、カテゴリの大きさの順に、大きいものから小さいものへ並べた棒からなる。
Look at Figure 1.5 and Figure 1.6 and determine which graph (pie or bar) you think displays the comparisons better.
It is a good idea to look at a variety of graphs to see which is the most helpful in displaying the data. We might make different choices of what we think is the “best” graph depending on the data and the context. Our choice also depends on what we are using the data for.
英語のヒント
どれがデータを示すのに最も役立つかを知るには、さまざまなグラフを見るとよい。「最良」と考えるグラフは、データや文脈によって変わることがある。何のためにデータを使うかによっても、選択は変わる。
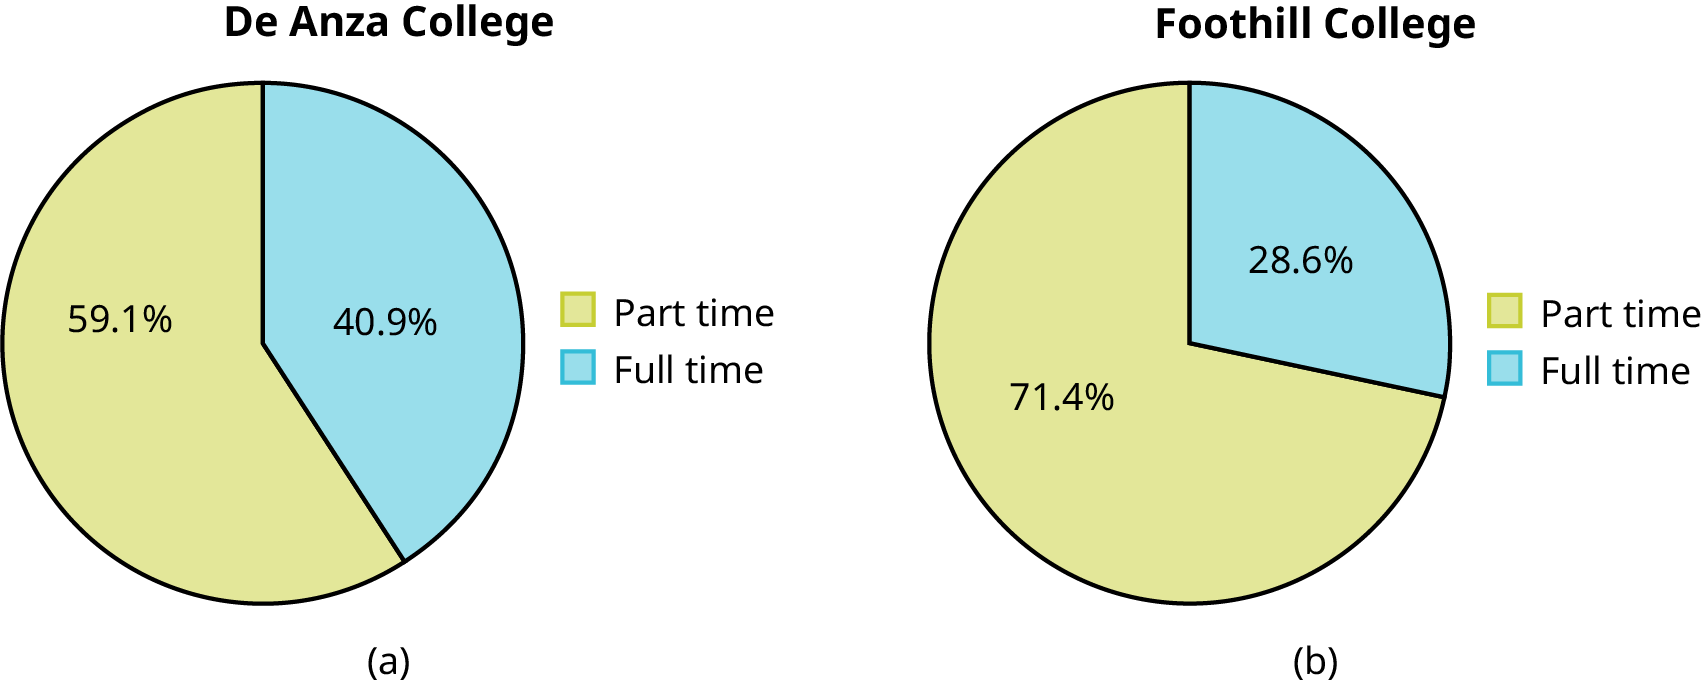
Figure 1.5図 1.5
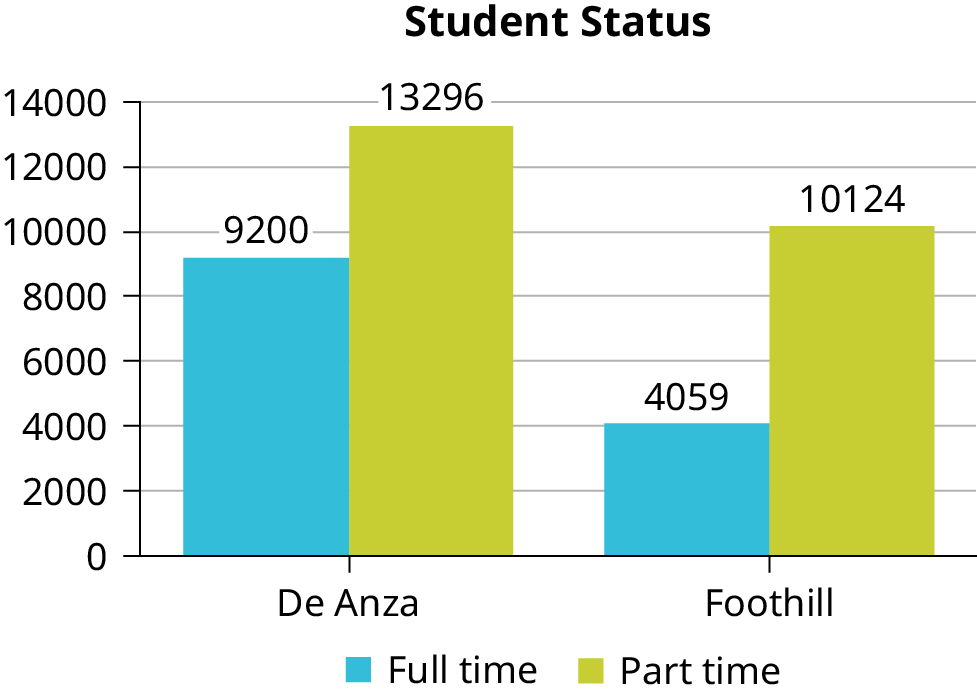
Figure 1.6図 1.6
Percentages That Add to More (or Less) Than 100%合計が100%を超える、または下回る百分率
Sometimes percentages add up to be more than 100% (or less than 100%). In the graph, the percentages add to more than 100% because students can be in more than one category. A bar graph is appropriate to compare the relative size of the categories. A pie chart cannot be used. It also could not be used if the percentages added to less than 100%.
百分率の合計が100%を超えたり、下回ったりすることがある。このグラフでは、学生が複数のカテゴリに属することがあるため、合計が100%を超える。カテゴリの相対的な大きさを比較するには、棒グラフが適切である。円グラフは使えない。百分率の合計が100%を下回る場合にも、円グラフは使えない。
Characteristic/Category 特徴/カテゴリ |
Percent 百分率 |
|---|---|
Full-Time Students フルタイム学生 |
40.9% |
Students who intend to transfer to a 4-year educational institution 4年制の教育機関への編入を予定している学生 |
48.6% |
Students under age 25 25歳未満の学生 |
61.0% |
TOTAL 合計 |
150.5% |
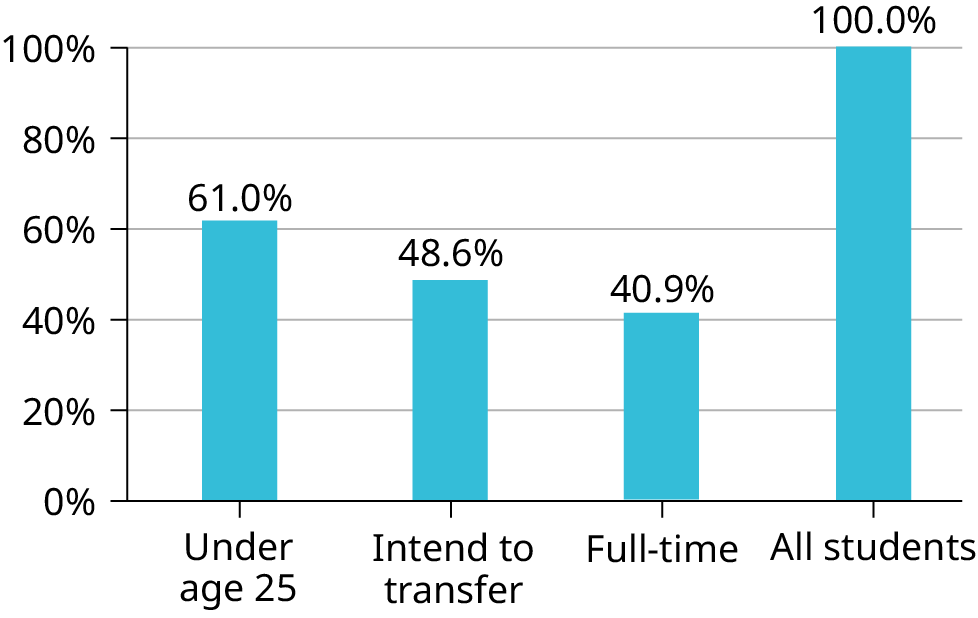
Figure 1.7図 1.7
Omitting Categories/Missing Dataカテゴリの省略/欠けているデータ
The table displays Ethnicity of Students but is missing the "Other/Unknown" category. This category contains people who did not feel they fit into any of the ethnicity categories or declined to respond. Notice that the frequencies do not add up to the total number of students. In this situation, create a bar graph and not a pie chart.
英語のヒント
表は学生の民族的背景を示しているが、「その他/不明」の区分が欠けている。この区分には、どの民族区分にも当てはまらないと考えた人や、回答を控えた人が含まれる。度数を合計しても、学生の総数にはならないことに注意しよう。このような場合には、円グラフではなく棒グラフを作る。
Frequency 度数 |
Percent 百分率 |
|
|---|---|---|
Asian アジア系 |
8,794 |
36.1% |
Black 黒人 |
1,412 |
5.8% |
Filipino フィリピン系 |
1,298 |
5.3% |
Hispanic/Latino ヒスパニック/ラティーノ |
4,180 |
17.1% |
Native American アメリカ先住民 |
146 |
0.6% |
Pacific Islander 太平洋諸島系 |
236 |
1.0% |
White 白人 |
5,978 |
24.5% |
TOTAL 合計 |
22,044 out of 24,382 24,382人中22,044人 |
90.4% out of 100% 100%のうち90.4% |
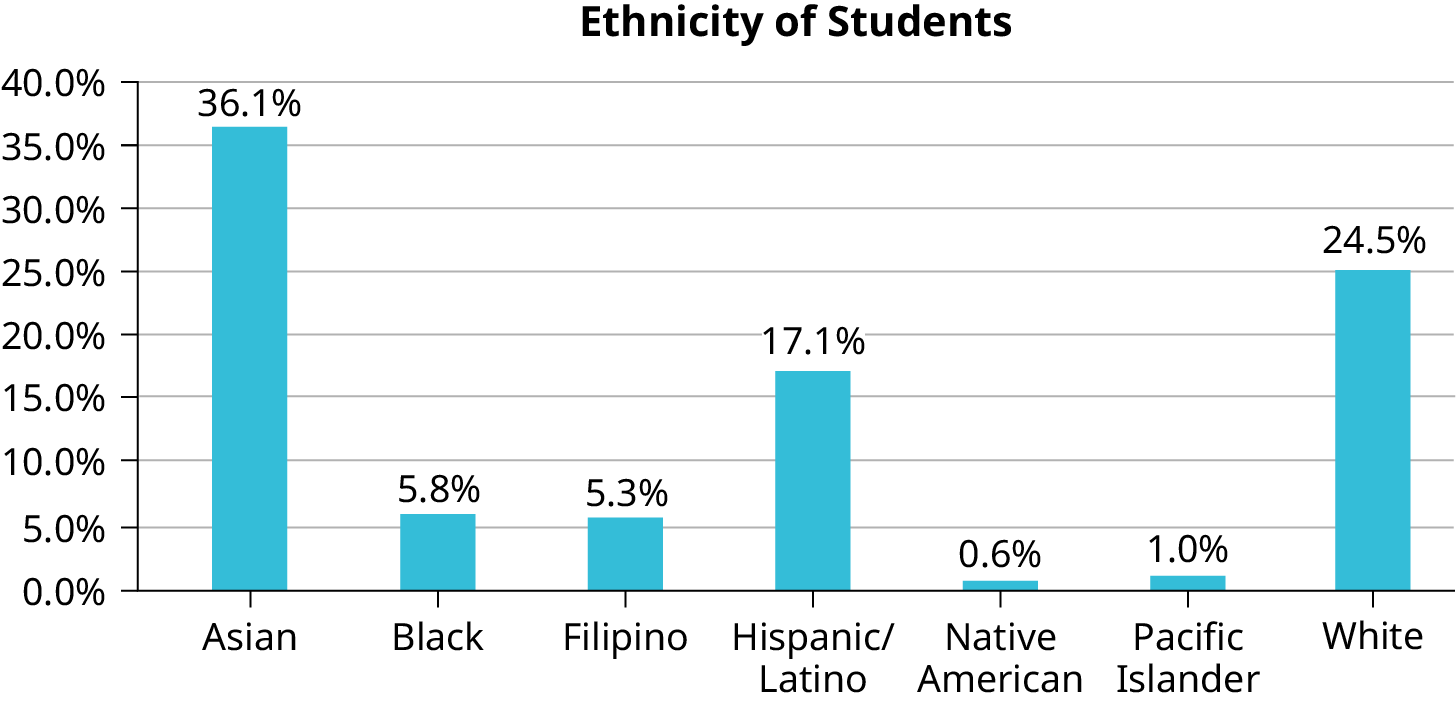
Figure 1.8図 1.8
The following graph is the same as the previous graph but the “Other/Unknown” percent (9.6%) has been included. The “Other/Unknown” category is large compared to some of the other categories (Native American, 0.6%, Pacific Islander 1.0%). This is important to know when we think about what the data are telling us.
次のグラフは、前のグラフに「その他/不明」の9.6%を加えたものである。この区分は、アメリカ先住民0.6%、太平洋諸島系1.0%といった一部の区分より大きい。データが何を伝えているかを考えるとき、この点を知っておくことは重要である。
This particular bar graph in Figure 1.9 can be difficult to understand visually. The graph in Figure 1.10 is a Pareto chart. The Pareto chart has the bars sorted from largest to smallest and is easier to read and interpret.
Bar Graph with Other/Unknown Category「その他/不明」を含めた棒グラフ
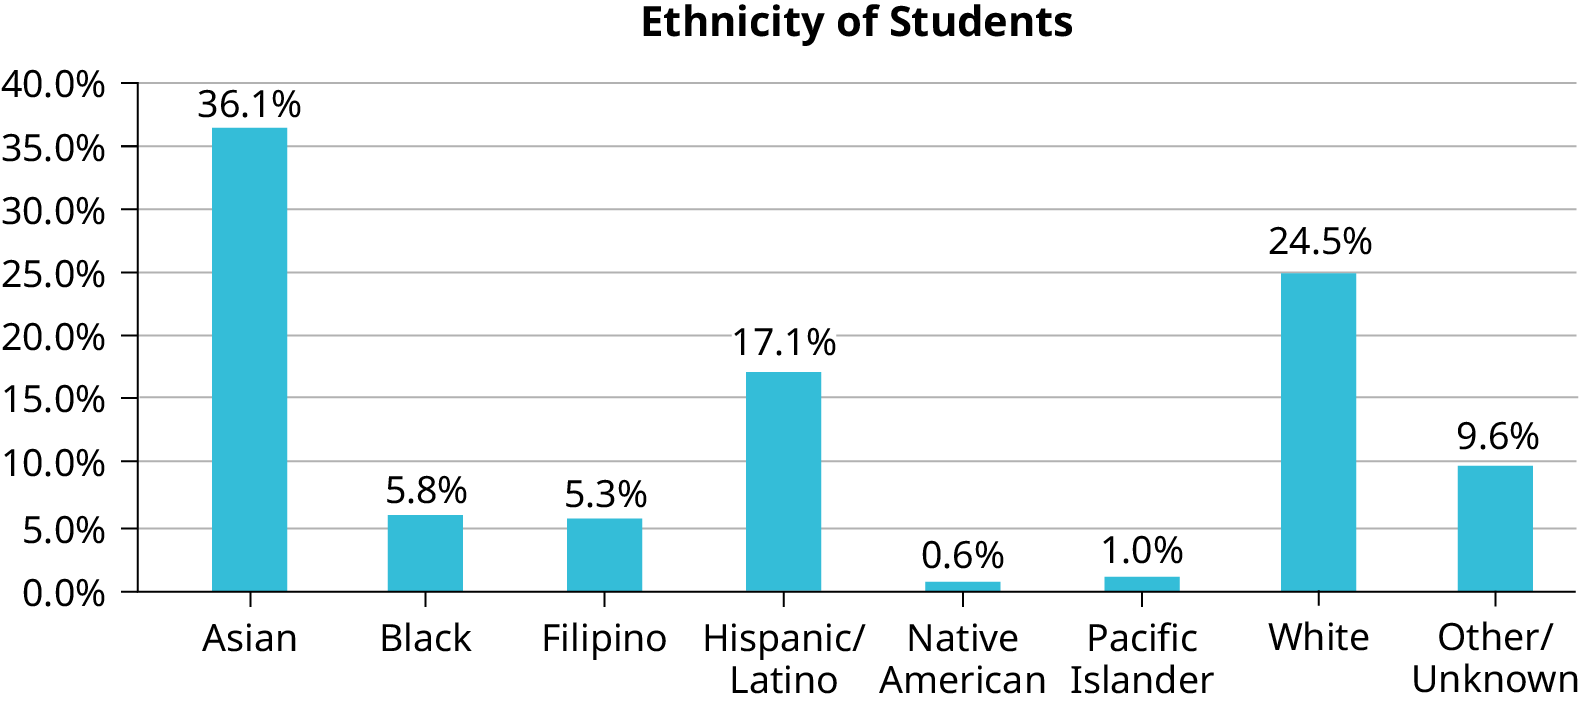
Figure 1.9図 1.9
Pareto Chart With Bars Sorted by Size棒を大きい順に並べたパレート図
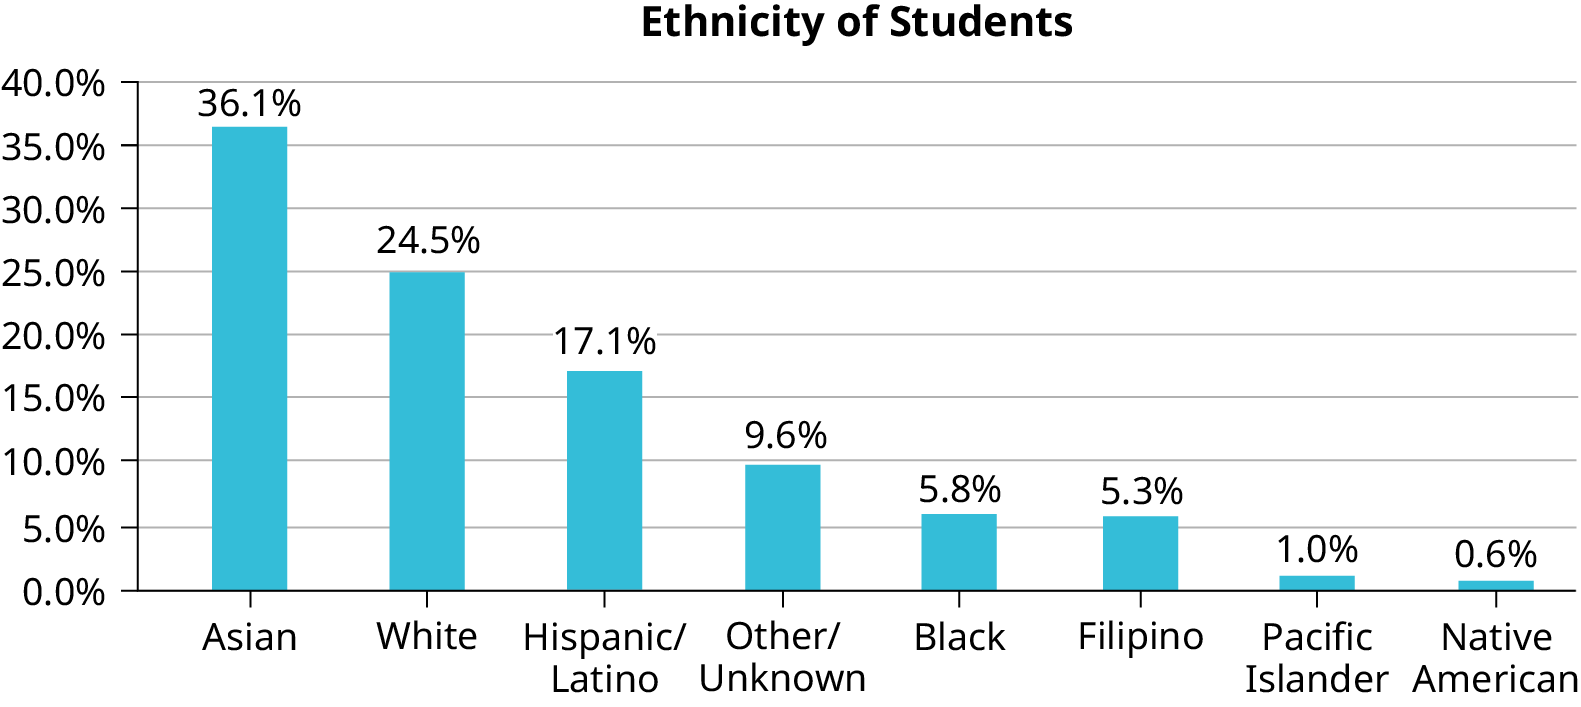
Figure 1.10図 1.10
Pie Charts: No Missing Data円グラフ:欠けたデータがない場合
The following pie charts have the “Other/Unknown” category included (since the percentages must add to 100%). The chart in Figure 1.11(b) is organized by the size of each wedge, which makes it a more visually informative graph than the unsorted, alphabetical graph in Figure 1.11(a).
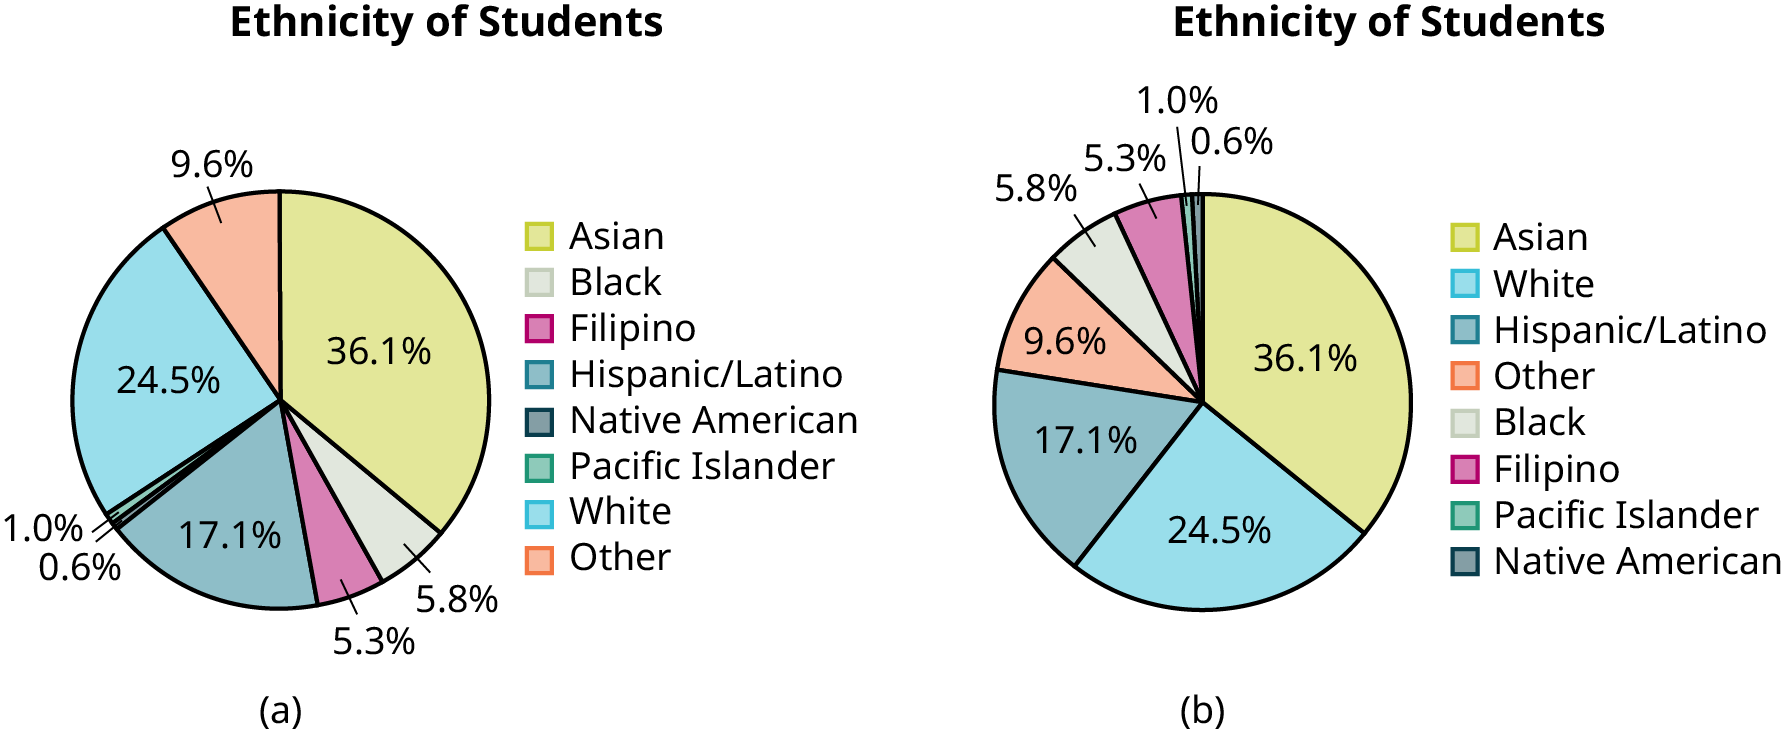


Figure 1.11図 1.11