第8章信頼区間
8.1 A Single Population Mean using the Normal Distribution8.1 正規分布を用いた1つの母平均の推定
A confidence interval for a population mean, when the population standard deviation is known, is based on the conclusion of the Central Limit Theorem that the sampling distribution of the sample means follow an approximately normal distribution. Suppose that our sample has a mean of and we have constructed the 90% confidence interval (5, 15) where EBM = 5.
母標準偏差が既知の場合の母平均の信頼区間は、標本平均の標本分布が近似的に正規分布に従うという中心極限定理の結論に基づく。標本平均がで、EBM = 5の90%信頼区間(5, 15)を作ったとする。
Calculating the Confidence Interval信頼区間の計算
To construct a confidence interval for a single unknown population mean μ, where the population standard deviation is known, we need as an estimate for μ and we need the margin of error. Here, the margin of error (EBM) is called the error bound for a population mean (abbreviated EBM). The sample mean is the point estimate of the unknown population mean μ.
母標準偏差が既知の場合、未知の1つの母平均μの信頼区間を作るには、μの推定値としてと、誤差限界が必要になる。ここでは、この誤差限界を母平均の誤差限界(略してEBM)と呼ぶ。標本平均は、未知の母平均μの点推定値である。
The confidence interval estimate will have the form:
信頼区間による推定は、次の形になる:
(point estimate - error bound, point estimate + error bound) or, in symbols,()
(点推定値 − 誤差限界, 点推定値 + 誤差限界)、記号では()
The margin of error (EBM) depends on the confidence level (abbreviated CL). The confidence level is often considered the probability that the calculated confidence interval estimate will contain the true population parameter. However, it is more accurate to state that the confidence level is the percent of confidence intervals that contain the true population parameter when repeated samples are taken. Most often, it is the choice of the person constructing the confidence interval to choose a confidence level of 90% or higher because that person wants to be reasonably certain of their conclusions.
英語のヒント
誤差限界EBMは信頼水準(略してCL)によって決まる。信頼水準は、計算した信頼区間による推定が真の母数を含む確率と考えられることが多い。しかし、標本抽出を繰り返したとき、真の母数を含む信頼区間の割合であると述べるほうが正確である。信頼区間を作る人は、自分の結論にかなりの確信を持ちたいので、90%以上の信頼水準を選ぶことが多い。
There is another probability called alpha (α). α is related to the confidence level, CL. α is the probability that the interval does not contain the unknown population parameter.
Mathematically, α + CL = 1.
Mathematically, α + CL = 1.
アルファ(α)と呼ばれる、もう1つの確率がある。αは信頼水準CLと関係している。αは、区間が未知の母数を含まない確率である。式では、α + CL = 1となる。
Example 8.1例題 8.1
- Suppose we have collected data from a sample. We know the sample mean but we do not know the mean for the entire population.標本からデータを集めたとする。標本平均は分かっているが、母集団全体の平均は分からない。
- The sample mean is seven, and the error bound for the mean is 2.5.標本平均は7、平均の誤差限界は2.5である。
= 7 and EBM = 2.5
= 7、EBM = 2.5
The confidence interval is (7 – 2.5, 7 + 2.5), and calculating the values gives (4.5, 9.5).
信頼区間は(7 − 2.5, 7 + 2.5)であり、値を計算すると(4.5, 9.5)となる。
If the confidence level (CL) is 95%, then we say that, "We estimate with 95% confidence that the true value of the population mean is between 4.5 and 9.5."
信頼水準CLが95%なら、「母平均の真の値は4.5から9.5の間にあると、95%の信頼度で推定する」と述べる。
A confidence interval for a population mean with a known standard deviation is based on the fact that the sample means follow an approximately normal distribution. Suppose that our sample has a mean of = 10, and we have constructed the 90% confidence interval (5, 15) where EBM = 5.
標準偏差が既知の場合の母平均の信頼区間は、標本平均が近似的に正規分布に従うという事実に基づく。標本平均が = 10で、EBM = 5の90%信頼区間(5, 15)を作ったとする。
To get a 90% confidence interval, we must include the central 90% of the probability of the normal distribution. If we include the central 90%, we leave out a total of α = 10% in both tails, or 5% in each tail, of the normal distribution.
英語のヒント
90%信頼区間を得るには、正規分布の確率の中央90%を含めなければならない。中央90%を含めると、正規分布の両裾には合計α = 10%、つまり各裾に5%ずつが残る。
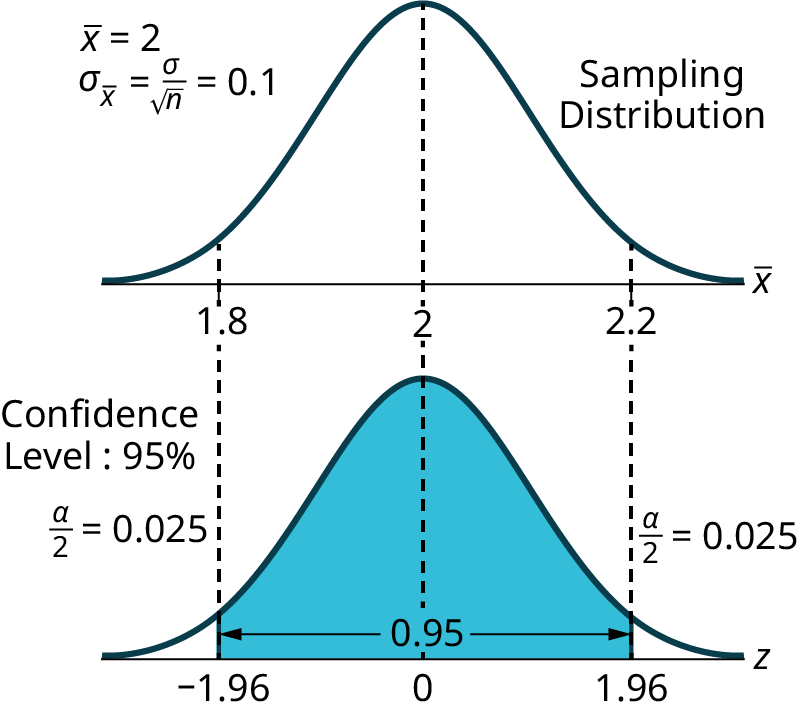

Figure 8.2図 8.2
To capture the central 90%, we must go out 1.645 "standard deviations" on either side of the calculated sample mean. The value 1.645 is the z-score from a standard normal probability distribution that puts an area of 0.90 in the center, an area of 0.05 in the far left tail, and an area of 0.05 in the far right tail.
中央90%を含めるには、計算した標本平均から両側に「標準偏差」1.645個分ずつ離れる必要がある。1.645は、標準正規確率分布の中央に面積0.90、左端の裾に面積0.05、右端の裾に面積0.05を取るzスコアである。
It is important that the "standard deviation" used must be appropriate for the parameter we are estimating, so in this section we need to use the standard deviation that applies to sample means, which is . The fraction , is commonly called the "standard error of the mean" in order to distinguish clearly the standard deviation for a mean from the population standard deviation σ.
英語のヒント
使う「標準偏差」は、推定しようとしている母数に適したものでなければならない。この節では、標本平均に適用される標準偏差を使う必要がある。平均の標準偏差と母標準偏差σを明確に区別するため、この分数は一般に「平均の標準誤差」と呼ばれる。
- is normally distributed, that is, ~ N.は正規分布に従う。すなわち、 ~ N。
- When the population standard deviation σ is known, we use a normal distribution to calculate the error bound.母標準偏差σが既知の場合は、正規分布を使って誤差限界を求める。