第8章信頼区間
References参考文献
“America’s Best Small Companies.” Forbes, 2013. Available online at http://www.forbes.com/best-small-companies/list/ (accessed July 2, 2013).
「米国の優良小企業」。Forbes、2013年。オンライン公開:http://www.forbes.com/best-small-companies/list/(2013年7月2日閲覧)。
Data from Microsoft Bookshelf.
データ出典:Microsoft Bookshelf。
Data from http://www.businessweek.com/.
データ出典:http://www.businessweek.com/。
Data from http://www.forbes.com/.
データ出典:http://www.forbes.com/。
“Disclosure Data Catalog: Leadership PAC and Sponsors Report, 2012.” Federal Election Commission. Available online at http://www.fec.gov/data/index.jsp (accessed July 2,2013).
「開示データ目録:リーダーシップPACと支援者の報告、2012年」。連邦選挙委員会。オンライン公開:http://www.fec.gov/data/index.jsp(2013年7月2日閲覧)。
“Human Toxome Project: Mapping the Pollution in People.” Environmental Working Group. Available online at http://www.ewg.org/sites/humantoxome/participants/participant-group.php?group=in+utero%2Fnewborn (accessed July 2, 2013).
「ヒューマン・トキソーム・プロジェクト:人体汚染の地図を作る」。Environmental Working Group。オンライン公開:http://www.ewg.org/sites/humantoxome/participants/participant-group.php?group=in+utero%2Fnewborn(2013年7月2日閲覧)。
“Metadata Description of Leadership PAC List.” Federal Election Commission. Available online at http://www.fec.gov/finance/disclosure/metadata/metadataLeadershipPacList.shtml (accessed July 2, 2013).
「リーダーシップPAC一覧のメタデータ説明」。連邦選挙委員会。オンライン公開:http://www.fec.gov/finance/disclosure/metadata/metadataLeadershipPacList.shtml(2013年7月2日閲覧)。
Chapter Review章の復習
In many cases, the researcher does not know the population standard deviation, σ, of the measure being studied. In these cases, it is common to use the sample standard deviation, s, as an estimate of σ. The normal distribution creates accurate confidence intervals when σ is known, but it is not as accurate when s is used as an estimate. In this case, the Student’s t-distribution is much better. Define a t-score using the following formula:
多くの場合、研究者は調べる量の母標準偏差σを知らない。このような場合、標本標準偏差sをσの推定値として使うのが一般的である。σが既知なら正規分布で正確な信頼区間が得られるが、sを推定値として使う場合は精度が落ちる。この場合、スチューデントのt分布のほうがずっとよい。次の公式でtスコアを定義する:
The t-score follows the Student’s t-distribution with n – 1 degrees of freedom. The confidence interval under this distribution is calculated with EBM = where is the t-score with area to the right equal to , s is the sample standard deviation, and n is the sample size. Use a table, calculator, or computer to find for a given α.
tスコアは自由度n − 1のスチューデントのt分布に従う。この分布での信頼区間は、EBM = を使って計算する。ここでは、右側の面積がに等しいtスコアで、sは標本標準偏差、nは標本の大きさである。指定されたαに対するは、表、電卓、またはコンピューターで求める。
Formula Review公式の復習
s = the standard deviation of sample values.
s = 標本の値の標準偏差。
is the formula for the t-score which measures how far away a measure is from the population mean in the Student’s t-distribution
はtスコアの公式であり、スチューデントのt分布において、測定値が母平均からどれほど離れているかを測る。
df = n - 1; the degrees of freedom for a Student’s t-distribution where n represents the size of the sample
df = n − 1はスチューデントのt分布の自由度である。nは標本の大きさを表す。
T~tdf the random variable, T, has a Student’s t-distribution with df degrees of freedom
T ~ tdfは、確率変数Tが自由度dfのスチューデントのt分布に従うことを表す。
= the error bound for the population mean when the population standard deviation is unknown
= 母標準偏差が未知の場合の、母平均の誤差限界。
is the t-score in the Student’s t-distribution with area to the right equal to
は、スチューデントのt分布において右側の面積がに等しいtスコアである。
The general form for a confidence interval for a single mean, population standard deviation unknown, Student's t is given by (lower bound, upper bound)
= (point estimate – EBM, point estimate + EBM)
=
= (point estimate – EBM, point estimate + EBM)
=
母標準偏差が未知の場合、スチューデントのt分布を使った1つの平均の信頼区間の一般形は、(下限, 上限)=(点推定値 − EBM, 点推定値 + EBM)= である。
Exercises 47–51練習問題 47–51
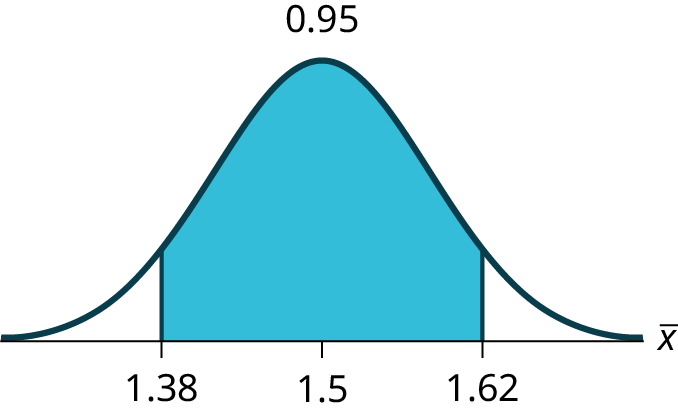
Use the following information to answer the next five exercises. A hospital is trying to cut down on emergency room wait times. It is interested in the amount of time patients must wait before being called back to be examined. An investigation committee randomly surveyed 70 patients. The sample mean was 1.5 hours with a sample standard deviation of 0.5 hours.
英語のヒント
次の情報を使って、続く5問に答えよ。ある病院が救急外来の待ち時間を短くしようとしている。関心があるのは、患者が診察に呼ばれるまで待つ時間である。調査委員会が70人の患者を無作為に調べ、標本平均1.5時間、標本標準偏差0.5時間を得た。
Exercise 47問題 47
Identify the following:
次の値を明らかにする:
- =_______
- =_______
- n =_______
- n – 1 =_______
Exercise 48問題 48
Define the random variables X and in words.
確率変数Xとを言葉で定義する。
Solution解き方
X is the number of hours a patient waits in the emergency room before being called back to be examined. is the mean wait time of 70 patients in the emergency room.
Xは患者が救急外来で診察に呼ばれるまで待つ時間である。は救急外来の患者70人の平均待ち時間である。
Exercise 49問題 49
Which distribution should you use for this problem?
この問題にはどの分布を使うべきか。
Exercise 50問題 50
Construct a 95% confidence interval for the population mean time spent waiting. State the confidence interval, sketch the graph, and calculate the error bound.
待ち時間の母平均の95%信頼区間を作れ。信頼区間を示し、グラフの概形を描き、誤差限界を計算せよ。
Exercise 51問題 51
Explain in complete sentences what the confidence interval means.
この信頼区間の意味を、完結した文で説明せよ。
Exercises 52–57練習問題 52–57
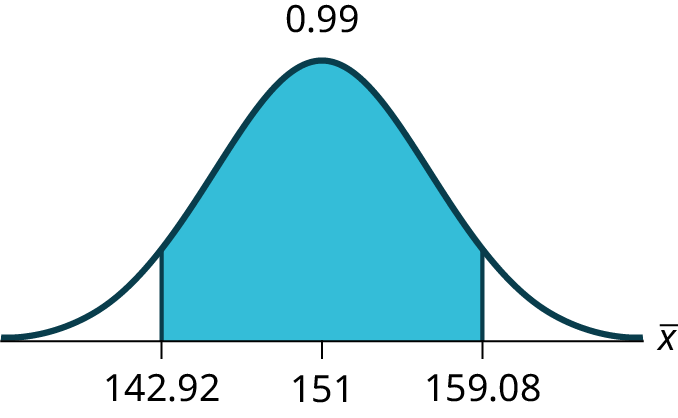
Use the following information to answer the next six exercises: One hundred eight Americans were surveyed to determine the number of hours they spend watching television each month. It was revealed that they watched an average of 151 hours each month with a standard deviation of 32 hours. Assume that the underlying population distribution is normal.
英語のヒント
次の情報を使って、続く6問に答えよ。米国人108人に、毎月テレビを見る時間を調査した。毎月の平均視聴時間は151時間、標準偏差は32時間と分かった。背景の母集団分布は正規分布と仮定する。
Exercise 52問題 52
Identify the following:
次の値を明らかにする:
- =_______
- =_______
- n =_______
- n – 1 =_______
Solution解き方
- = 151
- = 32
- n = 108
- n – 1 = 107
Exercise 53問題 53
Define the random variable X in words.
確率変数Xを言葉で定義せよ。
Exercise 54問題 54
Define the random variable in words.
確率変数を言葉で定義する。
Solution解き方
is the mean number of hours spent watching television per month from a sample of 108 Americans.
は、米国人108人の標本における、1か月にテレビを見る平均時間である。
Exercise 55問題 55
Which distribution should you use for this problem?
この問題にはどの分布を使うべきか。
Exercise 56問題 56
Construct a 99% confidence interval for the population mean hours spent watching television per month. (a) State the confidence interval, (b) sketch the graph, and (c) calculate the error bound.
1か月にテレビを見る時間の母平均の99%信頼区間を作れ。(a) 信頼区間を示し、(b) グラフの概形を描き、(c) 誤差限界を計算せよ。
Exercise 57問題 57
Why would the error bound change if the confidence level were lowered to 95%?
信頼水準を95%に下げると、なぜ誤差限界が変わるのか。
Exercises 58–62練習問題 58–62
Use the following information to answer the next 13 exercises: The data in Table 8.6 are the result of a random survey of 39 national flags (with replacement between picks) from various countries. We are interested in finding a confidence interval for the true mean number of colors on a national flag. Let X = the number of colors on a national flag.
次の情報を使って、続く13問に答えよ。表8.6は、さまざまな国の国旗から39回無作為に選んで調べた結果である(1回選ぶごとに元へ戻す)。国旗に使われる色の種類数の真の平均の信頼区間を求めたい。X = 国旗の色の種類数とする。
X |
Freq. 度数 |
|---|---|
1 |
1 |
2 |
7 |
3 |
18 |
4 |
7 |
5 |
6 |
Exercise 58問題 58
Calculate the following:
次の値を求める:
- =______
- =______
- n =______
Solution解き方
- 3.26
- 1.02
- 39
Exercise 59問題 59
Define the random variable in words.
確率変数を言葉で定義する。
Exercise 60問題 60
What is estimating?
は何を推定しているか。
Solution解き方
μ
Exercise 61問題 61
Is known?
は既知か。
Exercise 62問題 62
As a result of your answer to Exercise 61, state the exact distribution to use when calculating the confidence interval.
問題61の答えに基づき、信頼区間の計算に使う分布を正確に示せ。
Solution解き方
t38
Exercises 63–70練習問題 63–70
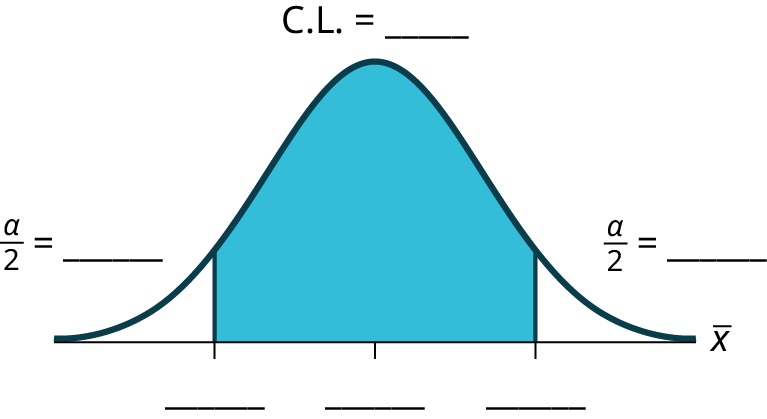
Construct a 95% confidence interval for the true mean number of colors on national flags.
国旗の色の種類数の真の平均の95%信頼区間を作れ。
Exercise 63問題 63
How much area is in both tails (combined)?
両裾の面積の合計はいくらか。
Exercise 64問題 64
How much area is in each tail?
各裾の面積はいくらか。
Solution解き方
0.025
Exercise 65問題 65
Calculate the following:
次の値を求める:
- lower limit下限
- upper limit上限
- error bound誤差限界
Exercise 66問題 66
The 95% confidence interval is_____.
95%信頼区間は_____である。
Solution解き方
(2.93, 3.59)
Exercise 67問題 67


Exercise 68問題 68
In one complete sentence, explain what the interval means.
完全な1文で、この区間が何を意味するか説明する。
Solution解き方
We are 95% confident that the true mean number of colors for national flags is between 2.93 colors and 3.59 colors.
国旗の色の種類数の真の平均は2.93色から3.59色の間にあると、95%の信頼度でいえる。
Exercise 69問題 69
Using the same , , and level of confidence, suppose that n were 69 instead of 39. Would the error bound become larger or smaller? How do you know?
、、信頼水準は同じにして、nが39ではなく69だったとする。誤差限界は大きくなるか、小さくなるか。どのように分かるか。
Solution解き方
The error bound would become EBM = 0.245. This error bound decreases because as sample sizes increase, variability decreases and we need less interval length to capture the true mean.
誤差限界はEBM = 0.245となる。標本の大きさが増すとばらつきが小さくなり、真の平均を捉えるために必要な区間の幅も狭くなるため、誤差限界は小さくなる。
Exercise 70問題 70
Using the same , , and n = 39, how would the error bound change if the confidence level were reduced to 90%? Why?
、、n = 39を同じにして、信頼水準を90%に下げると、誤差限界はどう変わるか。理由も述べよ。