第8章信頼区間
Formula Review公式の復習
The distribution of sample means is normally distributed with mean equal to the population mean and standard deviation given by the population standard deviation divided by the square root of the sample size.
。標本平均の分布は正規分布に従い、その平均は母平均と等しく、標準偏差は母標準偏差を標本の大きさの平方根で割ったものになる。
The general form for a confidence interval for a single population mean, known standard deviation, normal distribution is given by
(lower bound, upper bound) = (point estimate – EBM, point estimate + EBM)
=
=
(lower bound, upper bound) = (point estimate – EBM, point estimate + EBM)
=
=
標準偏差が既知で正規分布を使う、1つの母平均の信頼区間の一般形は、(下限, 上限)=(点推定値 − EBM, 点推定値 + EBM)= = である。
EBM = = the error bound for the mean, or the margin of error for a single population mean; this formula is used when the population standard deviation is known.
EBM = は、1つの母平均の誤差限界である。この公式は母標準偏差が既知の場合に使う。
CL = confidence level, or the proportion of confidence intervals created that are expected to contain the true population parameter
CL = 信頼水準。すなわち、作られた信頼区間のうち、真の母数を含むと期待されるものの割合である。
α = 1 – CL = the proportion of confidence intervals that will not contain the population parameter
α = 1 − CL = 母数を含まない信頼区間の割合。
= the z-score with the property that the area to the right of the z-score is this is the z-score used in the calculation of "EBM where α = 1 – CL.
= 右側の面積がとなる性質を持つzスコア。これはEBMの計算で使うzスコアであり、α = 1 − CLである。
n = = the formula used to determine the sample size (n) needed to achieve a desired margin of error at a given level of confidence
n = は、指定した信頼水準のもとで希望する誤差限界を実現するために必要な標本の大きさnを求める公式である。
General form of a confidence interval
信頼区間の一般形
(lower value, upper value) = (point estimate−error bound, point estimate + error bound)
(下端の値, 上端の値)=(点推定値 − 誤差限界, 点推定値 + 誤差限界)
To find the error bound when you know the confidence interval
信頼区間が分かっているときの誤差限界の求め方
error bound = upper value−point estimate OR error bound =
誤差限界 = 上端の値 − 点推定値、または、誤差限界 =
Single Population Mean, Known Standard Deviation, Normal Distribution
1つの母平均、既知の標準偏差、正規分布
Use the Normal Distribution for Means, Population Standard Deviation is Known EBM = z
母標準偏差が既知の場合、平均には正規分布を使う。EBM = z。
The confidence interval has the format ( − EBM, + EBM).
信頼区間の形は( − EBM, + EBM)である。
Exercises 1–5練習問題 1–5
Use the following information to answer the next five exercises: The standard deviation of the weights of elephants is known to be approximately 15 pounds. We wish to construct a 95% confidence interval for the mean weight of newborn elephant calves. Fifty newborn elephants are weighed. The sample mean is 244 pounds. The sample standard deviation is 11 pounds.
英語のヒント
次の情報を使って、続く5問に答えよ。ゾウの体重の標準偏差は約15ポンドと分かっている。生まれたばかりの子ゾウの平均体重の95%信頼区間を作りたい。50頭の子ゾウを量ったところ、標本平均は244ポンド、標本標準偏差は11ポンドだった。
Exercise 1問題 1
Identify the following:
次の値を明らかにする:
- = _____
- σ = _____
- n = _____
Solution解き方
- 244
- 15
- 50
Exercise 2問題 2
In words, define the random variables X and .
確率変数Xとを言葉で定義する。
Exercise 3問題 3
Which distribution should you use for this problem?
この問題にはどの分布を使うべきか。
Solution解き方
Exercise 4問題 4
Construct a 95% confidence interval for the population mean weight of newborn elephants. State the confidence interval, sketch the graph, and calculate the error bound.
新生のゾウの母平均体重の95%信頼区間を作れ。信頼区間を示し、グラフの概形を描き、誤差限界を計算せよ。
Exercise 5問題 5
What will happen to the confidence interval obtained, if 500 newborn elephants are weighed instead of 50? Why?
新生のゾウを50頭ではなく500頭量ると、得られる信頼区間はどうなるか。理由も述べよ。
Solution解き方
As the sample size increases, there will be less variability in the mean, so the interval size decreases.
標本の大きさが増えると平均のばらつきが小さくなるため、区間の幅は狭くなる。
Exercises 6–12練習問題 6–12
Use the following information to answer the next seven exercises: The U.S. Census Bureau conducts a study to determine the time needed to complete the short form. The Bureau surveys 200 people. The sample mean is 8.2 minutes. There is a known standard deviation of 2.2 minutes. The population distribution is assumed to be normal.
次の情報を使って、続く7問に答えよ。米国国勢調査局が、簡易調査票の記入にかかる時間を調べる。200人を調査し、標本平均8.2分を得た。標準偏差は2.2分と分かっている。母集団分布は正規分布と仮定する。
Exercise 6問題 6
Identify the following:
次の値を明らかにする:
- = _____
- σ = _____
- n = _____
Exercise 7問題 7
In words, define the random variables X and .
確率変数Xとを言葉で定義する。
Solution解き方
X is the time in minutes it takes to complete the U.S. Census short form. is the mean time it took a sample of 200 people to complete the U.S. Census short form.
Xは米国国勢調査の簡易調査票の記入にかかる時間(分)である。は200人の標本が調査票の記入に要した平均時間である。
Exercise 8問題 8
Which distribution should you use for this problem?
この問題にはどの分布を使うべきか。
Exercise 9問題 9
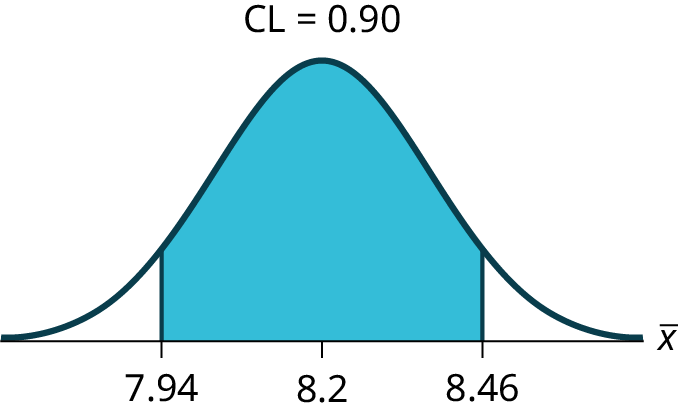
Construct a 90% confidence interval for the population mean time to complete the forms. State the confidence interval, sketch the graph, and calculate the error bound.
調査票の記入にかかる時間の母平均の90%信頼区間を作れ。信頼区間を示し、グラフの概形を描き、誤差限界を計算せよ。
Exercise 10問題 10
If the Census wants to increase its level of confidence and keep the error bound the same by taking another survey, what changes should it make?
国勢調査局が再調査を行い、誤差限界を同じに保ちながら信頼水準を上げたい場合、何を変えるべきか。
Exercise 11問題 11
If the Census did another survey, kept the error bound the same, and surveyed only 50 people instead of 200, what would happen to the level of confidence? Why?
国勢調査局が再調査し、誤差限界を同じに保ちながら200人ではなく50人だけを調べた場合、信頼水準はどうなるか。理由も述べよ。
Solution解き方
The level of confidence would decrease because decreasing n makes the confidence interval wider, so at the same error bound, the confidence level decreases.
信頼水準は下がる。nを減らすと信頼区間は広くなるため、誤差限界を同じにすると信頼水準が下がるからである。
Exercise 12問題 12
Suppose the Census needed to be 98% confident of the population mean length of time. Would the Census have to survey more people? Why or why not?
国勢調査局が所要時間の母平均について98%の信頼度を必要とするとする。調べる人数を増やす必要があるか。その理由を述べよ。
Exercises 13–22練習問題 13–22
Use the following information to answer the next ten exercises: A sample of 20 heads of lettuce was selected. Assume that the population distribution of head weight is normal. The weight of each head of lettuce was then recorded. The mean weight was 2.2 pounds with a standard deviation of 0.1 pounds. The population standard deviation is known to be 0.2 pounds.
英語のヒント
次の情報を使って、続く10問に答えよ。レタス20玉の標本を選んだ。1玉の重さの母集団分布は正規分布とする。それぞれの重さを記録すると、平均は2.2ポンド、標準偏差は0.1ポンドだった。母標準偏差は0.2ポンドと分かっている。
Exercise 13問題 13
Identify the following:
次の値を明らかにする:
- = ______
- σ = ______
- n = ______
Solution解き方
- = 2.2
- σ = 0.2
- n = 20
Exercise 14問題 14
In words, define the random variable X.
確率変数Xを言葉で定義する。
Exercise 15問題 15
In words, define the random variable .
確率変数を言葉で定義する。
Solution解き方
is the mean weight of a sample of 20 heads of lettuce.
は、レタス20玉の標本の平均重量である。
Exercise 16問題 16
Which distribution should you use for this problem?
この問題にはどの分布を使うべきか。
Exercise 17問題 17
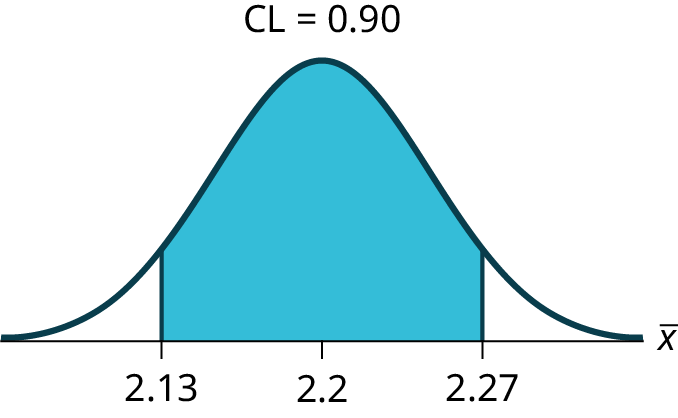
Construct a 90% confidence interval for the population mean weight of the heads of lettuce. State the confidence interval, sketch the graph, and calculate the error bound.
レタス1玉の母平均重量の90%信頼区間を作れ。信頼区間を示し、グラフの概形を描き、誤差限界を計算せよ。


Exercise 18問題 18
Construct a 95% confidence interval for the population mean weight of the heads of lettuce. State the confidence interval, sketch the graph, and calculate the error bound.
レタス1玉の母平均重量の95%信頼区間を作れ。信頼区間を示し、グラフの概形を描き、誤差限界を計算せよ。
Exercise 19問題 19
In complete sentences, explain why the confidence interval in Exercise 18 is wider than in Exercise 17.
Solution解き方
The interval is greater because the level of confidence increased. If the only change made in the analysis is a change in confidence level, then all we are doing is changing how much area is being calculated for the normal distribution. Therefore, a larger confidence level results in larger areas and larger intervals.
英語のヒント
信頼水準が上がったため、区間は広くなる。分析で変えたのが信頼水準だけなら、正規分布について計算する面積の大きさだけを変えていることになる。そのため、信頼水準が上がると面積も区間も大きくなる。
Exercise 20問題 20
In complete sentences, give an interpretation of what the interval in Exercise 18 means.
問題18の区間が何を意味するかを、完結した文で解釈せよ。
Exercise 21問題 21
What would happen if 40 heads of lettuce were sampled instead of 20, and the error bound remained the same?
レタスを20玉ではなく40玉抽出し、誤差限界を同じに保つとどうなるか。
Solution解き方
The confidence level would increase.
信頼水準が上がる。
Exercise 22問題 22
What would happen if 40 heads of lettuce were sampled instead of 20, and the confidence level remained the same?
レタスを20玉ではなく40玉抽出し、信頼水準を同じに保つとどうなるか。
Exercises 23–29練習問題 23–29
Use the following information to answer the next 14 exercises: The mean age for all Foothill College students for a recent Fall term was 33.2. The population standard deviation has been pretty consistent at 15. Suppose that twenty-five Winter students were randomly selected. The mean age for the sample was 30.4. We are interested in the true mean age for Winter Foothill College students. Let X = the age of a Winter Foothill College student.
英語のヒント
次の情報を使って、続く14問に答えよ。最近のある秋学期におけるフットヒル・カレッジの全学生の平均年齢は33.2歳だった。母標準偏差は15歳でほぼ一定である。冬学期の学生25人を無作為に選んだとする。その標本の平均年齢は30.4歳だった。関心があるのは、同校の冬学期の学生の真の平均年齢である。X = 同校の冬学期の学生1人の年齢とする。
Exercise 23問題 23
= _____
Solution解き方
30.4
Exercise 24問題 24
n = _____
Exercise 25問題 25
________ = 15
Solution解き方
σ
Exercise 26問題 26
In words, define the random variable .
確率変数を言葉で定義する。
Exercise 27問題 27
What is estimating?
は何を推定しているか。
Solution解き方
μ
Exercise 28問題 28
Is known?
は既知か。
Exercise 29問題 29
As a result of your answer to Exercise 26, state the exact distribution to use when calculating the confidence interval.
問題26の答えに基づき、信頼区間の計算で使う分布を正確に示せ。
Solution解き方
normal
正規分布