第8章信頼区間
Calculating the Confidence Interval信頼区間の計算
To construct a confidence interval estimate for an unknown population mean, we need data from a random sample. The steps to construct and interpret the confidence interval are:
未知の母平均について信頼区間による推定を行うには、無作為標本のデータが必要である。信頼区間を作り、解釈する手順は次のとおりである:
- Calculate the sample mean from the sample data. Remember, in this section we already know the population standard deviation σ.標本データから標本平均を求める。この節では、母標準偏差σがすでに分かっていることを忘れないようにする。
- Find the z-score that corresponds to the confidence level.
英語のヒント
信頼水準に対応するzスコアを求める。 - Calculate the error bound EBM.誤差限界EBMを求める。
- Construct the confidence interval.信頼区間を作る。
- Write a sentence that interprets the estimate in the context of the situation in the problem. (Explain what the confidence interval means, in the words of the problem.)問題の状況に即して推定値を解釈する文を書く。信頼区間が何を意味するかを、問題で使われている言葉で説明する。
We will first examine each step in more detail, and then illustrate the process with some examples.
英語のヒント
まず各手順を詳しく検討し、その後、いくつかの例で手順を示す。
Finding the z-score for the Stated Confidence Level指定された信頼水準のzスコアを求める
When we know the population standard deviation σ, we use a standard normal distribution to calculate the error bound EBM and construct the confidence interval. We need to find the value of z that puts an area equal to the confidence level (in decimal form) in the middle of the standard normal distribution Z ~ N(0, 1).
母標準偏差σが分かっている場合は、標準正規分布を使って誤差限界EBMを求め、信頼区間を作る。標準正規分布Z ~ N(0, 1)の中央に、信頼水準を小数で表した値に等しい面積を取るzの値を求める必要がある。
The confidence level, CL, is the area in the middle of the standard normal distribution. CL = 1 – α, so α is the area that is split equally between the two tails. Each of the tails contains an area equal to .
英語のヒント
信頼水準CLは、標準正規分布の中央の面積である。CL = 1 − αなので、αは2つの裾に等分される面積である。各裾の面積はに等しい。
The z-score that has an area to the right of is denoted by .
英語のヒント
右側の面積がとなるzスコアを、で表す。
For example, when CL = 0.95, α = 0.05 and = 0.025; we write = z0.025.
たとえば、CL = 0.95のとき、α = 0.05、 = 0.025となる。このとき、 = z0.025と書く。
The area to the right of z0.025 is 0.025 and the area to the left of z0.025 is 1 – 0.025 = 0.975.
z0.025の右側の面積は0.025であり、z0.025の左側の面積は1 − 0.025 = 0.975である。
, using a calculator, computer or a standard normal probability table.
電卓、コンピューター、または標準正規分布の確率表を使うと、となる。
Using the Calculator電卓の操作
Writing the Interpretation解釈の書き方
The interpretation should clearly state the confidence level (CL), explain what population parameter is being estimated (here, a population mean), and state the confidence interval (both endpoints). "We estimate with ___% confidence that the true population mean (include the context of the problem) is between ___ and ___ (include appropriate units)."
英語のヒント
解釈では、信頼水準CLを明示し、どの母数を推定するのか(ここでは母平均)を説明して、信頼区間の両端を示す必要がある。「真の母平均(問題の状況を含める)は___から___の間(適切な単位を含める)にあると、___%の信頼度で推定する。」
Example 8.2例題 8.2
Suppose scores on exams in statistics are normally distributed with an unknown population mean and a population standard deviation of three points. A random sample of 36 scores is taken and gives a sample mean (sample mean score) of 68. Find a confidence interval estimate for the population mean exam score (the mean score on all exams).
統計学の試験の点数が、母平均は未知、母標準偏差は3点の正規分布に従うとする。36個の点数からなる無作為標本を取り、標本平均(標本の平均点)68を得た。試験の母平均点(すべての試験の平均点)の信頼区間による推定を求める。
Find a 90% confidence interval for the true (population) mean of statistics exam scores.
統計学の試験の真の平均点(母平均)の90%信頼区間を求めよ。
Solution解き方
- You can use technology to calculate the confidence interval directly.機器やソフトウェアを使えば、信頼区間を直接計算できる。
- The first solution is shown step-by-step.1つ目の解法を、順を追って示す。
- The second solution uses the TI-83, 83+, and 84+ calculators.2つ目の解法では、TI-83、83+、84+の電卓を使う。
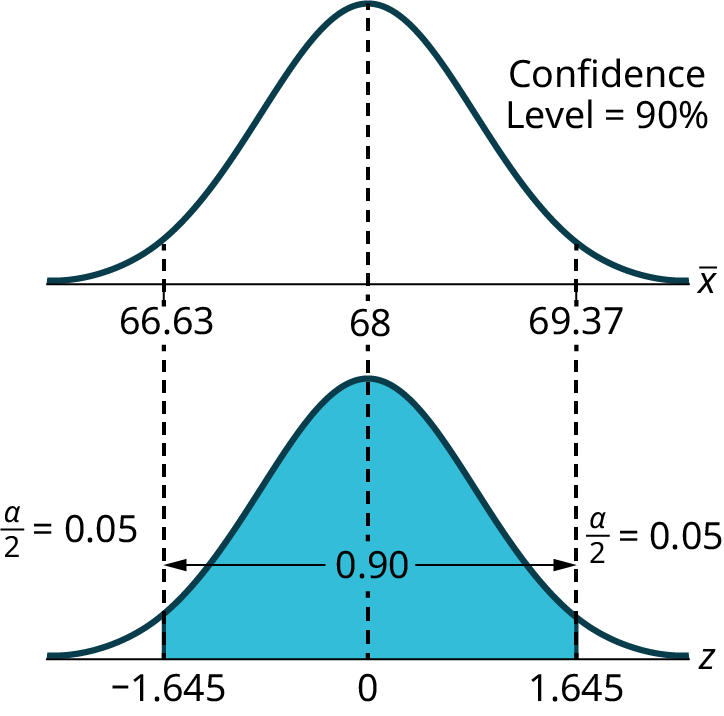
Figure 8.3図 8.3
The solution is shown step by step:
解法を順を追って示す:
The formula for a confidence interval for an unknown population mean assuming we know the population standard deviation is:
母標準偏差が既知であると仮定したときの、未知の母平均の信頼区間の公式は次のとおりである:
For a 90% confidence interval, visualize an area of 0.90 centered under the normal curve (See Figure 8.3). The remaining area for the two tails of the normal distribution is then 0.10, which indicates that the area in the left tail is one-half of 0.10, which is 0.05. The corresponding z-score that cuts off an area of 0.05 in the left tail is 1.645.
英語のヒント
90%信頼区間では、正規曲線の下の中央に面積0.90を取った状態を思い描く(図8.3参照)。残る正規分布の両裾の面積は0.10なので、左裾の面積は0.10の半分の0.05となる。左裾の面積0.05を区切る、対応するzスコアは1.645である。
In this example we are given that the population standard deviation .
この例では、母標準偏差が与えられている。
We are also given that the sample size n = 36 and the sample mean .
また、標本の大きさn = 36と、標本平均が与えられている。
Substituting these values in the confidence interval formula results in the following:
これらの値を信頼区間の公式に代入すると、次のようになる:
We estimate with 90% confidence that the true population mean exam score for all statistics students is between 67.18 and 68.82.
統計学を学ぶ全学生の試験の真の母平均点は67.18から68.82の間にあると、90%の信頼度で推定する。
Solution解き方
Using the Calculator電卓の操作
Explanation of 90% Confidence Level: Ninety percent of all confidence intervals constructed in this way contain the true mean statistics exam score. For example, if we constructed 100 of these confidence intervals, we would expect 90 of them to contain the true population mean exam score.
信頼水準90%の説明:この方法で作ったすべての信頼区間の90%が、統計学の試験の真の平均点を含む。たとえば、この信頼区間を100個作れば、そのうち90個が真の母平均点を含むと期待される。
Example 8.3例題 8.3
The Specific Absorption Rate (SAR) for a cell phone measures the amount of radio frequency (RF) energy absorbed by the user’s body when using the handset. Every cell phone emits RF energy. Different phone models have different SAR measures. To receive certification from the Federal Communications Commission (FCC) for sale in the United States, the SAR level for a cell phone must be no more than 1.6 watts per kilogram. Table 8.1 shows the highest SAR level for a random selection of cell phone models as measured by the FCC.
英語のヒント
携帯電話の比吸収率(SAR)は、端末を使うときに利用者の体に吸収される高周波(RF)エネルギーの量を測る指標である。どの携帯電話もRFエネルギーを放出する。機種によってSARの測定値は異なる。米国で販売するために連邦通信委員会(FCC)の認証を受けるには、携帯電話のSAR値が1キログラム当たり1.6ワット以下でなければならない。表8.1は、無作為に選んだ携帯電話の機種について、FCCが測定した最高SAR値を示す。
SAR Data for a sample of 30 cell phones 携帯電話30台の標本のSARデータ |
||
|---|---|---|
1.11 |
1.36 |
0.74 |
1.48 |
1.34 |
0.5 |
1.43 |
1.18 |
0.4 |
1.3 |
1.3 |
0.867 |
1.09 |
1.26 |
0.68 |
0.455 |
1.29 |
0.51 |
1.41 |
0.36 |
1.13 |
0.82 |
0.52 |
0.3 |
0.78 |
1.6 |
1.48 |
1.25 |
1.39 |
1.38 |
Find a 98% confidence interval for the true (population) mean of the Specific Absorption Rates (SARs) for cell phones. Assume that the population standard deviation is σ = 0.337.
携帯電話の比吸収率(SAR)の真の平均(母平均)の98%信頼区間を求めよ。母標準偏差はσ = 0.337とする。
Solution解き方
To find the confidence interval, start by finding the point estimate: the sample mean.
信頼区間を求めるには、まず点推定値である標本平均を求める。
Next, find the EBM. Because you are creating a 98% confidence interval, CL = 0.98.
次にEBMを求める。98%信頼区間を作るので、CL = 0.98である。
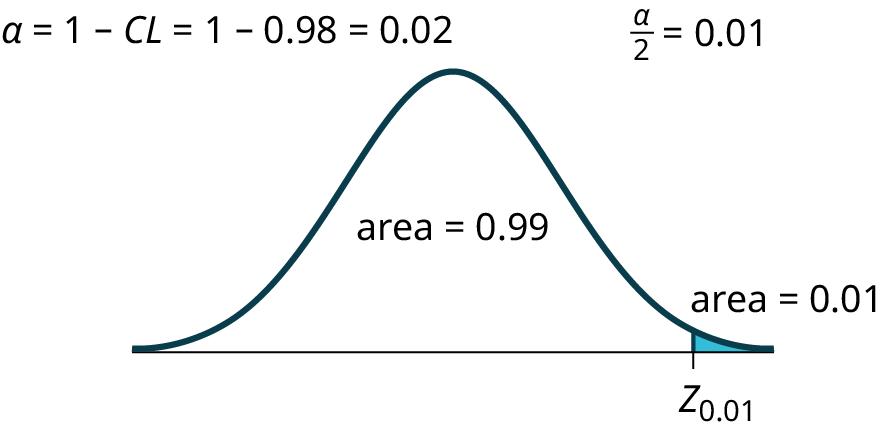


Figure 8.4図 8.4
You need to find z0.01 having the property that the area under the normal density curve to the right of z0.01 is 0.01 and the area to the left is 0.99. Use your calculator, a computer, or a probability table for the standard normal distribution to find z0.01 = 2.326.
正規密度曲線の下で、z0.01の右側の面積が0.01、左側の面積が0.99となる性質を持つz0.01を求める必要がある。電卓、コンピューター、または標準正規分布の確率表を使うと、z0.01 = 2.326となる。
To find the 98% confidence interval, find .
98%信頼区間を求めるには、を求める。
– EBM = 1.024 – 0.1431 = 0.8809
− EBM = 1.024 − 0.1431 = 0.8809
– EBM = 1.024 – 0.1431 = 1.1671
− EBM = 1.024 − 0.1431 = 1.1671
We estimate with 98% confidence that the true SAR mean for the population of cell phones in the United States is between 0.8809 and 1.1671 watts per kilogram.
米国の携帯電話という母集団の真の平均SARは、1キログラム当たり0.8809から1.1671ワットの間にあると、98%の信頼度で推定する。
Solution解き方
Using the Calculator電卓の操作
Notice the difference in the confidence intervals calculated in Example 8.3 and the following Try It exercise. These intervals are different for several reasons: they were calculated from different samples, the samples were different sizes, and the intervals were calculated for different levels of confidence. Even though the intervals are different, they do not yield conflicting information. The effects of these kinds of changes are the subject of the next section in this chapter.