第8章信頼区間
Exercises 30–37練習問題 30–37
Construct a 95% Confidence Interval for the true mean age of Winter Foothill College students by working out then answering the next seven exercises.
続く7問を解いて答え、フットヒル・カレッジの冬学期の学生の真の平均年齢の95%信頼区間を作れ。
Exercise 30問題 30
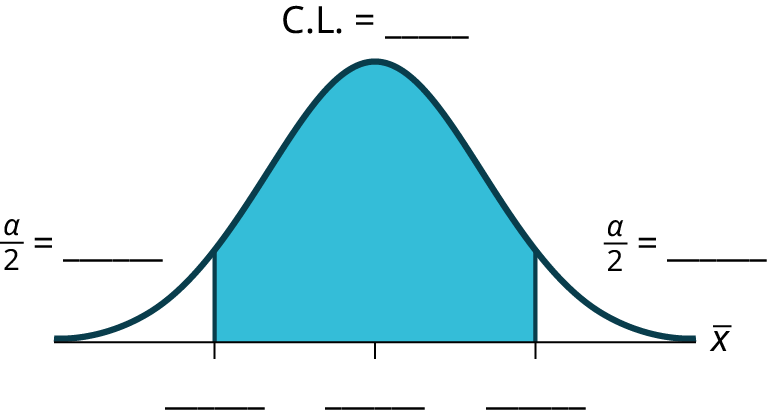
How much area is in both tails (combined)? α =________
両裾の面積の合計はいくらか。α = ________
Exercise 31問題 31
How much area is in each tail? =________
各裾の面積はいくらか。 = ________
Solution解き方
0.025
Exercise 32問題 32
Identify the following specifications:
次の値を特定せよ:
- lower limit下限
- upper limit上限
- error bound誤差限界
Exercise 33問題 33
The 95% confidence interval is:__________________.
95%信頼区間は__________________である。
Solution解き方
(24.52,36.28)
Exercise 34問題 34
Exercise 35問題 35
In one complete sentence, explain what the interval means.
完全な1文で、この区間が何を意味するか説明する。
Solution解き方
We are 95% confident that the true mean age for Winger Foothill College students is between 24.52 and 36.28.
フットヒル・カレッジの冬学期の学生の真の平均年齢は、24.52歳から36.28歳の間にあると95%の信頼度でいえる。
Exercise 36問題 36
Using the same mean, standard deviation, and level of confidence, suppose that n were 69 instead of 25. Would the error bound become larger or smaller? How do you know?
平均、標準偏差、信頼水準は同じとし、nが25ではなく69だったとする。誤差限界は大きくなるか、小さくなるか。どのように分かるか。
Exercise 37問題 37
Using the same mean, standard deviation, and sample size, how would the error bound change if the confidence level were reduced to 90%? Why?
平均、標準偏差、標本の大きさを同じにして、信頼水準を90%に下げると、誤差限界はどう変わるか。理由も述べよ。
Solution解き方
The error bound for the mean would decrease because as the CL decreases, you need less area under the normal curve (which translates into a smaller interval) to capture the true population mean.
平均の誤差限界は小さくなる。CLが下がると、真の母平均を捉えるために必要な正規曲線の下の面積が小さくなり、それが区間の狭まりにつながるからである。
Homework宿題
Exercises 38–46練習問題 38–46
Exercise 38問題 38
Among various ethnic groups, the standard deviation of heights is known to be approximately three inches. We wish to construct a 95% confidence interval for the mean height of male Swedes. Forty-eight male Swedes are surveyed. The sample mean is 71 inches. The sample standard deviation is 2.8 inches.
英語のヒント
さまざまな民族集団で、身長の標準偏差は約3インチと分かっている。スウェーデン人男性の平均身長の95%信頼区間を作りたい。48人を調べたところ、標本平均は71インチ、標本標準偏差は2.8インチだった。
- =________
- σ =________
- n =________
- In words, define the random variables X and .確率変数Xとを言葉で定義する。
- Which distribution should you use for this problem? Explain your choice.この問題にはどの分布を使うべきか。選んだ理由を説明する。
- Construct a 95% confidence interval for the population mean height of male Swedes.スウェーデン人男性の母平均身長の95%信頼区間を作れ。
- State the confidence interval.信頼区間を示す。
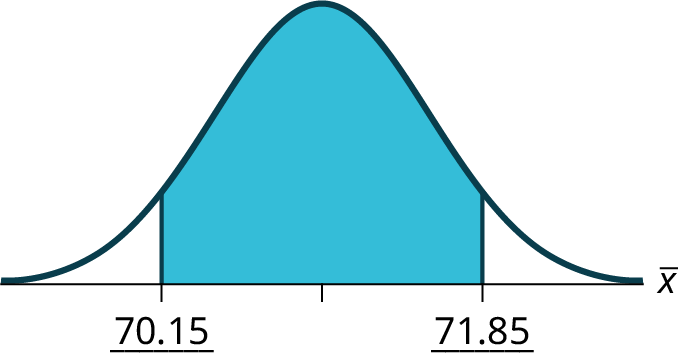
- Sketch the graph.グラフの概形を描く。
- Calculate the error bound.誤差限界を求める。
- What will happen to the level of confidence obtained if 1,000 male Swedes are surveyed instead of 48? Why?スウェーデン人男性を48人ではなく1000人調べると、得られる信頼水準はどうなるか。理由も述べよ。
Solution解き方
- 71
- 3
- 48
- X is the height of a Swiss male, and is the mean height from a sample of 48 Swiss males.Xはスイス人男性の身長であり、48人のスイス人男性の標本から得る平均身長を表す。
- Normal. We know the standard deviation for the population, and the sample size is greater than 30.正規分布。母標準偏差が分かっており、標本の大きさが30より大きいからである。
- CI: (70.151, 71.49)信頼区間:(70.151, 71.49)
- Figure 8.9図 8.9
- EBM = 0.849
- The confidence interval will decrease in size, because the sample size increased. Recall, when all factors remain unchanged, an increase in sample size decreases variability. Thus, we do not need as large an interval to capture the true population mean.標本の大きさが増えたため、信頼区間の幅は狭くなる。ほかの要因が変わらなければ、標本の大きさが増すとばらつきが小さくなることを思い出そう。したがって、真の母平均を捉えるために、それほど広い区間は必要なくなる。
Exercise 39問題 39
Announcements for 84 upcoming engineering conferences were randomly picked from a stack of IEEE Spectrum magazines. The mean length of the conferences was 3.94 days, with a standard deviation of 1.28 days. Assume the underlying population is normal.
英語のヒント
積み重ねたIEEE Spectrum誌から、今後開かれる工学関係の会議84件の案内を無作為に選んだ。会議の平均日数は3.94日、標準偏差は1.28日だった。背景の母集団は正規分布と仮定する。
- In words, define the random variables X and .確率変数Xとを言葉で定義する。
- Which distribution should you use for this problem? Explain your choice.この問題にはどの分布を使うべきか。選んだ理由を説明する。
- Construct a 95% confidence interval for the population mean length of engineering conferences.工学関係の会議の母平均日数の95%信頼区間を作れ。
- State the confidence interval.信頼区間を示す。
- Sketch the graph.グラフの概形を描く。
- Calculate the error bound.誤差限界を求める。
Exercise 40問題 40
Suppose that an accounting firm does a study to determine the time needed to complete one person’s tax forms. It randomly surveys 100 people. The sample mean is 23.6 hours. There is a known standard deviation of 7.0 hours. The population distribution is assumed to be normal.
英語のヒント
会計事務所が、1人分の税務書類を作成するために必要な時間を調べるとする。無作為に100人を調査し、標本平均23.6時間を得た。標準偏差は7.0時間と分かっている。母集団分布は正規分布と仮定する。
- =________
- σ =________
- n =________
- In words, define the random variables X and .確率変数Xとを言葉で定義する。
- Which distribution should you use for this problem? Explain your choice.この問題にはどの分布を使うべきか。選んだ理由を説明する。
- Construct a 90% confidence interval for the population mean time to complete the tax forms.税務書類の作成時間の母平均の90%信頼区間を作れ。
- State the confidence interval.信頼区間を示す。
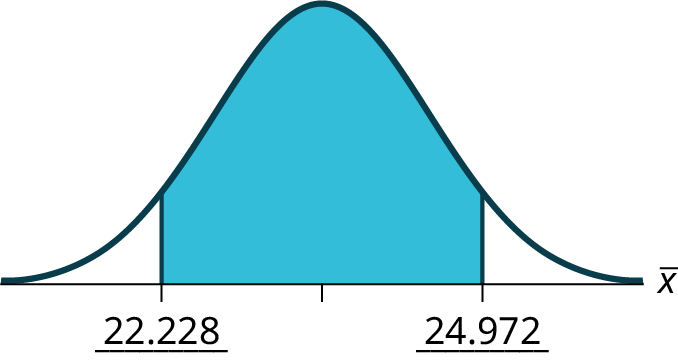
- Sketch the graph.グラフの概形を描く。
- Calculate the error bound.誤差限界を求める。
- If the firm wished to increase its level of confidence and keep the error bound the same by taking another survey, what changes should it make?事務所が再調査し、誤差限界を同じに保ちながら信頼水準を上げたい場合、何を変えるべきか。
- If the firm did another survey, kept the error bound the same, and only surveyed 49 people, what would happen to the level of confidence? Why?事務所が再調査し、誤差限界を同じに保ちながら49人だけを調べた場合、信頼水準はどうなるか。理由も述べよ。
- Suppose that the firm decided that it needed to be at least 96% confident of the population mean length of time to within one hour. How would the number of people the firm surveys change? Why?事務所が、所要時間の母平均を1時間以内の誤差で推定し、少なくとも96%の信頼度を得たいと決めたとする。調べる人数はどう変わるか。理由も述べよ。
Solution解き方
- = 23.6
- = 7
- n = 100
- X is the time needed to complete an individual tax form. is the mean time to complete tax forms from a sample of 100 customers.Xは1人分の税務書類の作成に必要な時間である。は100人の顧客の標本について、書類の作成にかかる平均時間である。
- because we know sigma.シグマが既知なので、である。
- (22.228, 24.972)
- Figure 8.10図 8.10
- EBM = 1.372
- It will need to change the sample size. The firm needs to determine what the confidence level should be, then apply the error bound formula to determine the necessary sample size.標本の大きさを変える必要がある。事務所は目標の信頼水準を決め、誤差限界の公式を使って必要な標本の大きさを求める。
- The confidence level would increase as a result of a larger interval. Smaller sample sizes result in more variability. To capture the true population mean, we need to have a larger interval.区間が広くなる結果、信頼水準は上がる。標本の大きさが小さいほど、ばらつきは大きくなる。真の母平均を捉えるには、区間を広くする必要がある。
- According to the error bound formula, the firm needs to survey 206 people. Since we increase the confidence level, we need to increase either our error bound or the sample size.誤差限界の公式によれば、事務所は206人を調べる必要がある。信頼水準を上げるので、誤差限界か標本の大きさのどちらかを増やす必要がある。
Exercise 41問題 41
A sample of 16 small bags of the same brand of candies was selected. Assume that the population distribution of bag weights is normal. The weight of each bag was then recorded. The mean weight was two ounces with a standard deviation of 0.12 ounces. The population standard deviation is known to be 0.1 ounce.
同じ銘柄のキャンディーの小袋16袋からなる標本を選んだ。袋の重さの母集団分布は正規分布とする。各袋の重さを記録すると、平均は2オンス、標準偏差は0.12オンスだった。母標準偏差は0.1オンスと分かっている。
- =________
- σ =________
- sx =________
- In words, define the random variable X.確率変数Xを言葉で定義する。
- In words, define the random variable .確率変数を言葉で定義する。
- Which distribution should you use for this problem? Explain your choice.この問題にはどの分布を使うべきか。選んだ理由を説明する。
- Construct a 90% confidence interval for the population mean weight of the candies.キャンディーの母平均重量の90%信頼区間を作れ。
- State the confidence interval.信頼区間を示す。
- Sketch the graph.グラフの概形を描く。
- Calculate the error bound.誤差限界を求める。
- Construct a 98% confidence interval for the population mean weight of the candies.キャンディーの母平均重量の98%信頼区間を作れ。
- State the confidence interval.信頼区間を示す。
- Sketch the graph.グラフの概形を描く。
- Calculate the error bound.誤差限界を求める。
- In complete sentences, explain why the confidence interval in part f is larger than the confidence interval in part e.fの信頼区間がeの信頼区間より広い理由を、完結した文で説明せよ。
- In complete sentences, give an interpretation of what the interval in part f means.fの区間が何を意味するかを、完結した文で解釈せよ。
Exercise 42問題 42
A camp director is interested in the mean number of letters each child sends during their camp session. The population standard deviation is known to be 2.5. A survey of 20 campers is taken. The mean from the sample is 7.9 with a sample standard deviation of 2.8.
キャンプの責任者が、参加中に子ども1人が出す手紙の平均通数に関心を持っている。母標準偏差は2.5と分かっている。参加者20人を調査したところ、標本平均は7.9、標本標準偏差は2.8だった。
- =________
- σ =________
- n =________
- Define the random variables X and in words.確率変数Xとを言葉で定義する。
- Which distribution should you use for this problem? Explain your choice.この問題にはどの分布を使うべきか。選んだ理由を説明する。
- Construct a 90% confidence interval for the population mean number of letters campers send home.キャンプ参加者が家に送る手紙の通数の母平均の90%信頼区間を作れ。
- State the confidence interval.信頼区間を示す。
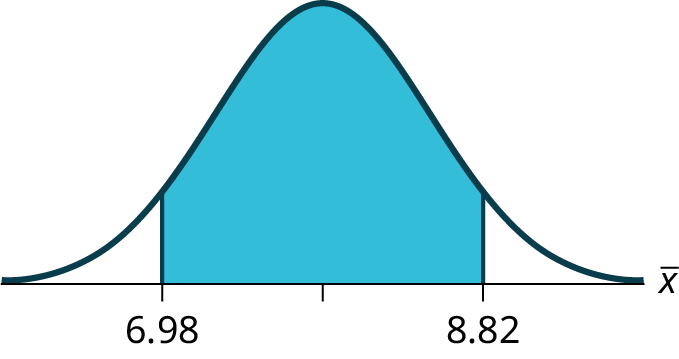
- Sketch the graph.グラフの概形を描く。
- Calculate the error bound.誤差限界を求める。
- What will happen to the error bound and confidence interval if 500 campers are surveyed? Why?参加者500人を調べると、誤差限界と信頼区間はどうなるか。理由も述べよ。
Solution解き方
- 7.9
- 2.5
- 20
- X is the number of letters a single camper will send home. is the mean number of letters sent home from a sample of 20 campers.Xは、参加者1人が家に送る手紙の通数である。は、参加者20人の標本について、家に送る手紙の平均通数である。
- N
- CI: (6.98, 8.82)信頼区間:(6.98, 8.82)
- Figure 8.11図 8.11
- EBM: 0.92EBM:0.92
- The error bound and confidence interval will decrease.誤差限界は小さくなり、信頼区間は狭くなる。


Exercise 43問題 43
What is meant by the term “90% confident” when constructing a confidence interval for a mean?
平均の信頼区間を作る際にいう「信頼度90%」とは何を意味するか。
- If we took repeated samples, approximately 90% of the samples would produce the same confidence interval.標本抽出を繰り返すと、標本の約90%が同じ信頼区間を生む。
- If we took repeated samples, approximately 90% of the confidence intervals calculated from those samples would contain the sample mean.標本抽出を繰り返すと、その標本から計算した信頼区間の約90%が標本平均を含む。
- If we took repeated samples, approximately 90% of the confidence intervals calculated from those samples would contain the true value of the population mean.標本抽出を繰り返すと、その標本から計算した信頼区間の約90%が母平均の真の値を含む。
- If we took repeated samples, the sample mean would equal the population mean in approximately 90% of the samples.標本抽出を繰り返すと、標本の約90%で標本平均が母平均と等しくなる。
Exercise 44問題 44
The Federal Election Commission collects information about campaign contributions and disbursements for candidates and political committees each election cycle. During a certain campaign season, there were 1,619 candidates for the House of Representatives across the United States who received contributions from individuals. Table 8.3 shows the total receipts from individuals for a random selection of 40 House candidates rounded to the nearest $100. The standard deviation for this data to the nearest hundred is σ = $909,200.
英語のヒント
連邦選挙委員会は選挙のたびに、候補者と政治委員会の選挙運動の献金や支出に関する情報を収集する。ある選挙運動期間には、全米で1619人の下院議員候補が個人から献金を受け取った。表8.3は無作為に選んだ下院候補40人について、個人から受け取った総額を100ドル単位に丸めて示している。このデータの標準偏差は、100ドル単位でσ = 909,200ドルである。
$3,600 |
$1,243,900 |
$10,900 |
$385,200 |
$581,500 |
$7,400 |
$2,900 |
$400 |
$3,714,500 |
$632,500 |
$391,000 |
$467,400 |
$56,800 |
$5,800 |
$405,200 |
$733,200 |
$8,000 |
$468,700 |
$75,200 |
$41,000 |
$13,300 |
$9,500 |
$953,800 |
$1,113,500 |
$1,109,300 |
$353,900 |
$986,100 |
$88,600 |
$378,200 |
$13,200 |
$3,800 |
$745,100 |
$5,800 |
$3,072,100 |
$1,626,700 |
$512,900 |
$2,309,200 |
$6,600 |
$202,400 |
$15,800 |
- Find the point estimate for the population mean.母平均の点推定値を求めよ。
- Using 95% confidence, calculate the error bound.信頼水準95%を使って誤差限界を計算せよ。
- Create a 95% confidence interval for the mean total individual contributions.個人献金総額の平均の95%信頼区間を作れ。
- Interpret the confidence interval in the context of the problem.問題の状況に即して信頼区間を解釈せよ。
Solution解き方
- = $568,873
- CL = 0.95 α = 1 – 0.95 = 0.05 = 1.96
EBM = = 1.96 = $281,764CL = 0.95、α = 1 − 0.95 = 0.05、 = 1.96、EBM = = 1.96 = 281,764ドル。 - − EBM = 568,873 − 281,764 = 287,109
+ EBM = 568,873 + 281,764 = 850,637− EBM = 568,873 − 281,764 = 287,109。 + EBM = 568,873 + 281,764 = 850,637。Alternate solution:別解: - We estimate with 95% confidence that the mean amount of contributions received from all individuals by House candidates is between $287,109 and $850,637.下院候補がすべての個人から受け取る献金総額の平均は287,109ドルから850,637ドルの間にあると、95%の信頼度で推定する。
Exercise 45問題 45
The American Community Survey (ACS), part of the United States Census Bureau, conducts a yearly census similar to the one taken every ten years, but with a smaller percentage of participants. The recent survey estimates with 90% confidence that the mean household income in the U.S. falls between $69,720 and $69,922. Find the point estimate for mean U.S. household income and the error bound for mean U.S. household income.
英語のヒント
米国国勢調査局のアメリカン・コミュニティ・サーベイ(ACS)は、10年ごとの国勢調査に似た調査を、より少ない割合の参加者で毎年行う。最近の調査では、米国の平均世帯所得は69,720ドルから69,922ドルの間にあると90%の信頼度で推定された。米国の平均世帯所得の点推定値と誤差限界を求めよ。
Exercise 46問題 46
The average height of young adult males has a normal distribution with standard deviation of 2.5 inches. You want to estimate the mean height of students at your college or university to within one inch with 93% confidence. How many male students must you measure?
若年成人男性の平均身長は、標準偏差2.5インチの正規分布に従う。自分の大学の学生の平均身長を、1インチ以内の誤差、93%の信頼度で推定したい。男子学生を何人測る必要があるか。
Solution解き方
Use the formula for EBM, solved for n:
EBMの公式をnについて解いた式を使う:
From the statement of the problem, you know that σ = 2.5, and you need EBM = 1.
問題文からσ = 2.5と分かり、EBM = 1にする必要がある。
z = z0.035 = 1.812
(This is the value of z for which the area under the density curve to the right of z is 0.035.)
(これは、密度曲線の下でzの右側の面積が0.035となるzの値である。)
You need to measure at least 21 male students to achieve your goal.
目標を達成するには、少なくとも21人の男子学生を測定する必要がある。
Confidence Level (CL)
信頼水準(CL)
the percent expression for the probability that the confidence interval contains the true population parameter; for example, if the CL = 90%, then in 90 out of 100 samples the interval estimate will enclose the true population parameter.
信頼区間が真の母数を含む確率を百分率で表したもの。たとえばCL = 90%なら、100個の標本のうち90個で、区間推定が真の母数を囲む。
Error Bound for a Population Mean (EBM)
母平均の誤差限界(EBM)
the margin of error; depends on the confidence level, sample size, and known or estimated population standard deviation.
推定の誤差の限界。信頼水準、標本の大きさ、既知または推定された母標準偏差によって決まる。