第8章信頼区間
Homework宿題
Exercises 71–81練習問題 71–81
Exercise 71問題 71
In six packages of “The Flintstones® Real Fruit Snacks” there were five Bam-Bam snack pieces. The total number of snack pieces in the six bags was 68. We wish to calculate a 96% confidence interval for the population proportion of Bam-Bam snack pieces.
「原始家族フリントストーン® リアルフルーツスナック」6袋の中に、バンバンの形のスナックが5個あった。6袋のスナックは合計68個だった。バンバンの形のスナックの母比率の96%信頼区間を計算したい。
- Define the random variables X and P′ in words.確率変数XとP′を言葉で定義する。
- Which distribution should you use for this problem? Explain your choiceこの問題にはどの分布を使うべきか。選んだ理由を説明せよ。
- Calculate p′.p′を計算せよ。
- Construct a 96% confidence interval for the population proportion of Bam-Bam snack pieces per bag.1袋に含まれるバンバンの形のスナックの母比率の96%信頼区間を作れ。
- State the confidence interval.信頼区間を示す。
- Sketch the graph.グラフの概形を描く。
- Calculate the error bound.誤差限界を求める。
- Do you think that six packages of fruit snacks yield enough data to give accurate results? Why or why not?フルーツスナック6袋から、正確な結果に十分なデータが得られると思うか。その理由を述べよ。
Exercise 72問題 72
A random survey of enrollment at 35 community colleges across the United States yielded the following figures: 6,414; 1,550; 2,109; 9,350; 21,828; 4,300; 5,944; 5,722; 2,825; 2,044; 5,481; 5,200; 5,853; 2,750; 10,012; 6,357; 27,000; 9,414; 7,681; 3,200; 17,500; 9,200; 7,380; 18,314; 6,557; 13,713; 17,768; 7,493; 2,771; 2,861; 1,263; 7,285; 28,165; 5,080; 11,622. Assume the underlying population is normal.
英語のヒント
米国のコミュニティ・カレッジ35校の在籍者数を無作為に調査し、次の値を得た:6,414; 1,550; 2,109; 9,350; 21,828; 4,300; 5,944; 5,722; 2,825; 2,044; 5,481; 5,200; 5,853; 2,750; 10,012; 6,357; 27,000; 9,414; 7,681; 3,200; 17,500; 9,200; 7,380; 18,314; 6,557; 13,713; 17,768; 7,493; 2,771; 2,861; 1,263; 7,285; 28,165; 5,080; 11,622。背景の母集団は正規分布と仮定する。
- = __________
- = __________
- n = __________
- n – 1 = __________
- Define the random variables and in words.確率変数とを言葉で定義する。
- Which distribution should you use for this problem? Explain your choice.この問題にはどの分布を使うべきか。選んだ理由を説明する。
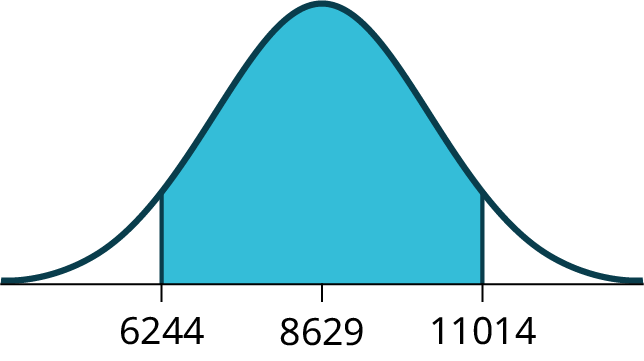
- Construct a 95% confidence interval for the population mean enrollment at community colleges in the United States.米国のコミュニティ・カレッジの在籍者数の母平均の95%信頼区間を作れ。
- State the confidence interval.信頼区間を示す。
- Sketch the graph.グラフの概形を描く。
- Calculate the error bound.誤差限界を求める。
- What will happen to the error bound and confidence interval if 500 community colleges were surveyed? Why?コミュニティ・カレッジを500校調べると、誤差限界と信頼区間はどうなるか。理由も述べよ。
Exercise 73問題 73
Suppose that a committee is studying whether or not there is waste of time in our judicial system. It is interested in the mean amount of time individuals waste at the courthouse waiting to be called for jury duty. The committee randomly surveyed 81 people who recently served as jurors. The sample mean wait time was eight hours with a sample standard deviation of four hours.
英語のヒント
司法制度に時間の無駄があるかを委員会が調べているとする。関心があるのは、人々が裁判所で陪審員として呼ばれるまで待つことに費やす平均時間である。委員会は最近陪審員を務めた81人を無作為に調査した。標本平均待ち時間は8時間、標本標準偏差は4時間だった。
- = __________
- = __________
- n = __________
- n – 1 = __________
- Define the random variables and in words.確率変数とを言葉で定義する。
- Which distribution should you use for this problem? Explain your choice.この問題にはどの分布を使うべきか。選んだ理由を説明する。
- Construct a 95% confidence interval for the population mean time wasted.無駄にした時間の母平均の95%信頼区間を作れ。
- State the confidence interval.信頼区間を示す。
- Sketch the graph.グラフの概形を描く。
- Calculate the error bound.誤差限界を求める。
- Explain in a complete sentence what the confidence interval means.信頼区間の意味を、完結した文で説明せよ。
Exercise 74問題 74
A pharmaceutical company makes tranquilizers. It is assumed that the distribution for the length of time they last is approximately normal. Researchers in a hospital used the drug on a random sample of nine patients. The effective period of the tranquilizer for each patient (in hours) was as follows: 2.7; 2.8; 3.0; 2.3; 2.3; 2.2; 2.8; 2.1; and 2.4.
英語のヒント
ある製薬会社が精神安定剤を作っている。効果の持続時間の分布は近似的に正規分布とする。病院の研究者が、無作為に選んだ患者9人にこの薬を使用した。各患者の効果の持続時間(時間)は、2.7; 2.8; 3.0; 2.3; 2.3; 2.2; 2.8; 2.1; 2.4だった。
- = __________
- = __________
- n = __________
- n – 1 = __________
- Define the random variable in words.確率変数を言葉で定義する。
- Define the random variable in words.確率変数を言葉で定義する。
- Which distribution should you use for this problem? Explain your choice.この問題にはどの分布を使うべきか。選んだ理由を説明する。
- Construct a 95% confidence interval for the population mean length of time.持続時間の母平均の95%信頼区間を作れ。
- State the confidence interval.信頼区間を示す。
- Sketch the graph.グラフの概形を描く。
- Calculate the error bound.誤差限界を求める。
- What does it mean to be “95% confident” in this problem?この問題で「信頼度95%」とは何を意味するか。
Solution解き方
- = 2.51
- = 0.318
- n = 9
- n - 1 = 8
- the effective length of time for a tranquilizer精神安定剤の効果の持続時間
- the mean effective length of time of tranquilizers from a sample of nine patients患者9人の標本における、精神安定剤の平均効果持続時間
- We need to use a Student’s-t distribution, because we do not know the population standard deviation.母標準偏差が分からないため、スチューデントのt分布を使う必要がある。
- CI: (2.27, 2.76)信頼区間:(2.27, 2.76)
- Answers may vary.解答はさまざまである。
- EBM: 0.25EBM:0.25
- If we were to sample many groups of nine patients, 95% of the samples would contain the true population mean length of time.患者9人ずつの集団を何度も抽出すると、その標本の95%が持続時間の真の母平均を含む。
Exercise 75問題 75
Suppose that 14 children, who were learning to ride two-wheel bikes, were surveyed to determine how long they had to use training wheels. It was revealed that they used them an average of six months with a sample standard deviation of three months. Assume that the underlying population distribution is normal.
英語のヒント
自転車の乗り方を習っている子ども14人に、補助輪をどれくらい使う必要があったかを調査したとする。平均使用期間は6か月、標本標準偏差は3か月と分かった。背景の母集団分布は正規分布と仮定する。
- = __________
- = __________
- n = __________
- n – 1 = __________
- Define the random variable in words.確率変数を言葉で定義する。
- Define the random variable in words.確率変数を言葉で定義せよ。
- Which distribution should you use for this problem? Explain your choice.この問題にはどの分布を使うべきか。選んだ理由を説明する。
- Construct a 99% confidence interval for the population mean length of time using training wheels.補助輪の使用期間の母平均の99%信頼区間を作れ。
- State the confidence interval.信頼区間を示す。
- Sketch the graph.グラフの概形を描く。
- Calculate the error bound.誤差限界を求める。
- Why would the error bound change if the confidence level were lowered to 90%?信頼水準を90%に下げると、なぜ誤差限界が変わるのか。
Exercise 76問題 76
The Federal Election Commission (FEC) collects information about campaign contributions and disbursements for candidates and political committees each election cycle. A political action committee (PAC) is a committee formed to raise money for candidates and campaigns. A Leadership PAC is a PAC formed by a federal politician (senator or representative) to raise money to help other candidates’ campaigns.
英語のヒント
連邦選挙委員会(FEC)は選挙のたびに、候補者と政治委員会の選挙運動の献金や支出に関する情報を収集する。政治活動委員会(PAC)は、候補者や選挙運動の資金を集めるために結成される委員会である。リーダーシップPACは、連邦議員(上院議員または下院議員)が、ほかの候補者の選挙運動を支援する資金を集めるために結成するPACである。
The FEC has reported financial information for 556 Leadership PACs that operating during a certain election cycle. The following table shows the total receipts during this cycle for a random selection of 30 Leadership PACs.
FECは、ある選挙期間に活動していたリーダーシップPAC556団体の財務情報を報告した。次の表は、無作為に選んだ30団体がこの期間に受け取った総額を示す。
$46,500.00 |
$0 |
$40,966.50 |
$105,887.20 |
$5,175.00 |
$29,050.00 |
$19,500.00 |
$181,557.20 |
$31,500.00 |
$149,970.80 |
$2,555,363.20 |
$12,025.00 |
$409,000.00 |
$60,521.70 |
$18,000.00 |
$61,810.20 |
$76,530.80 |
$119,459.20 |
$0 |
$63,520.00 |
$6,500.00 |
$502,578.00 |
$705,061.10 |
$708,258.90 |
$135,810.00 |
$2,000.00 |
$2,000.00 |
$0 |
$1,287,933.80 |
$219,148.30 |
Use this sample data to construct a 96% confidence interval for the mean amount of money raised by all Leadership PACs during the specific election cycle. Use the Student's t-distribution.
この標本データを使い、特定の選挙期間に全リーダーシップPACが集めた資金額の平均の96%信頼区間を作れ。スチューデントのt分布を使うこと。
Solution解き方
Note that we are not given the population standard deviation, only the standard deviation of the sample.
母標準偏差は与えられておらず、標本標準偏差だけが与えられている点に注意する。
There are 30 measures in the sample, so n = 30, and df = 30 - 1 = 29
標本に30個の測定値があるので、n = 30、df = 30 − 1 = 29となる。
CL = 0.96, so α = 1 - CL = 1 - 0.96 = 0.04
CL = 0.96なので、α = 1 − CL = 1 − 0.96 = 0.04となる。
= 2.150
- EBM = $251,854.23 - $204,561.66 = $47,292.57
− EBM = 251,854.23ドル − 204,561.66ドル = 47,292.57ドル
+ EBM = $251,854.23+ $204,561.66 = $456,415.89
+ EBM = 251,854.23ドル + 204,561.66ドル = 456,415.89ドル
We estimate with 96% confidence that the mean amount of money raised by all Leadership PACs during the specific election cycle lies between $47,292.57 and $456,415.89.
その選挙期間に全リーダーシップPACが集めた資金額の平均は47,292.57ドルから456,415.89ドルの間にあると、96%の信頼度で推定する。
Alternate Solution
別解
The difference between solutions arises from rounding differences.
解法間の結果の違いは、丸め方の違いによる。
Exercise 77問題 77
Forbes magazine published data on the best small firms in a certain year. These were firms that had been publicly traded for at least a year, have a stock price of at least $5 per share, and have reported annual revenue between $5 million and $1 billion. The Table 8.8 shows the ages of the corporate CEOs for a random sample of these firms.
英語のヒント
Forbes誌は、ある年の優良小企業についてのデータを公表した。対象は、少なくとも1年前から株式が公開され、1株当たりの株価が5ドル以上で、年間売上高が500万ドルから10億ドルの企業である。表8.8は、それらの企業から無作為に取った標本について、CEOの年齢を示す。
48 |
58 |
51 |
61 |
56 |
59 |
74 |
63 |
53 |
50 |
59 |
60 |
60 |
57 |
46 |
55 |
63 |
57 |
47 |
55 |
57 |
43 |
61 |
62 |
49 |
67 |
67 |
55 |
55 |
49 |
Use this sample data to construct a 90% confidence interval for the mean age of CEO’s for these top small firms. Use the Student's t-distribution.
この標本データを使い、これらの優良小企業のCEOの平均年齢の90%信頼区間を作れ。スチューデントのt分布を使うこと。
Exercise 78問題 78
Unoccupied seats on flights cause airlines to lose revenue. Suppose a large airline wants to estimate its mean number of unoccupied seats per flight over the past year. To accomplish this, the records of 225 flights are randomly selected and the number of unoccupied seats is noted for each of the sampled flights. The sample mean is 11.6 seats and the sample standard deviation is 4.1 seats.
英語のヒント
航空便の空席は、航空会社の収入を減らす。大手航空会社が、過去1年間の1便当たり平均空席数を推定したいとする。そのために225便の記録を無作為に選び、各便の空席数を記録した。標本平均は11.6席、標本標準偏差は4.1席だった。
- = __________
- = __________
- n = __________
- n-1 = __________
- Define the random variables and in words.確率変数とを言葉で定義する。
- Which distribution should you use for this problem? Explain your choice.この問題にはどの分布を使うべきか。選んだ理由を説明する。
- Construct a 92% confidence interval for the population mean number of unoccupied seats per flight.1便当たり空席数の母平均の92%信頼区間を作れ。
- State the confidence interval.信頼区間を示す。
- Sketch the graph.グラフの概形を描く。
- Calculate the error bound.誤差限界を求める。
Solution解き方
- = 11.6
- = 4.1
- n = 225
- n - 1 = 224
- X is the number of unoccupied seats on a single flight. is the mean number of unoccupied seats from a sample of 225 flights.Xは1便の空席数である。は225便の標本における平均空席数である。
- We will use a Student’s-t distribution, because we do not know the population standard deviation.母標準偏差が分からないため、スチューデントのt分布を使う。
- CI: (11.12 , 12.08)信頼区間:(11.12, 12.08)
- Answers may vary.解答はさまざまである。
- EBM: 0.48EBM:0.48
Exercise 79問題 79
In a recent sample of 84 used car sales costs, the sample mean was $6,425 with a standard deviation of $3,156. Assume the underlying distribution is approximately normal.
最近の中古車84台の販売価格の標本では、標本平均は6425ドル、標準偏差は3156ドルだった。背景の分布は近似的に正規分布と仮定する。
- Which distribution should you use for this problem? Explain your choice.この問題にはどの分布を使うべきか。選んだ理由を説明する。
- Define the random variable in words.確率変数を言葉で定義する。
- Construct a 95% confidence interval for the population mean cost of a used car.中古車価格の母平均の95%信頼区間を作れ。
- State the confidence interval.信頼区間を示す。
- Sketch the graph.グラフの概形を描く。
- Calculate the error bound.誤差限界を求める。
- Explain what a “95% confidence interval” means for this study.この研究において「95%信頼区間」が何を意味するか説明せよ。
Exercise 80問題 80
Six different national brands of chocolate chip cookies were randomly selected at the supermarket. The grams of fat per serving are as follows: 8; 8; 10; 7; 9; 9. Assume the underlying distribution is approximately normal.
スーパーマーケットで、全国販売されているチョコチップクッキーの銘柄を無作為に6種類選んだ。1食分の脂肪量(グラム)は、8; 8; 10; 7; 9; 9だった。背景の分布は近似的に正規分布と仮定する。
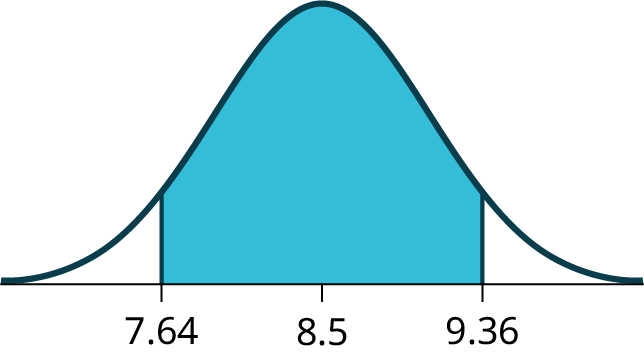
- Construct a 90% confidence interval for the population mean grams of fat per serving of chocolate chip cookies sold in supermarkets.スーパーマーケットで販売されるチョコチップクッキーの1食分の脂肪量(グラム)の母平均の90%信頼区間を作れ。
- State the confidence interval.信頼区間を示す。
- Sketch the graph.グラフの概形を描く。
- Calculate the error bound.誤差限界を求める。
- If you wanted a smaller error bound while keeping the same level of confidence, what should have been changed in the study before it was done?
英語のヒント
信頼水準を同じに保ちながら誤差限界を小さくしたい場合、調査を行う前に何を変えておくべきだったか。 - Go to the store and record the grams of fat per serving of six brands of chocolate chip cookies.店に行き、チョコチップクッキー6銘柄の1食分の脂肪量(グラム)を記録せよ。
- Calculate the mean.平均を計算せよ。
- Is the mean within the interval you calculated in part a? Did you expect it to be? Why or why not?その平均はaで計算した区間内にあるか。区間内にあると予想していたか。その理由を述べよ。
Solution解き方
- CI: (7.64 , 9.36)信頼区間:(7.64, 9.36)
- Figure 8.16図 8.16
- EBM: 0.86EBM:0.86
- The sample should have been increased.標本を大きくしておくべきだった。
- Answers will vary.答えはさまざまである。
- Answers will vary.答えはさまざまである。
- Answers will vary.答えはさまざまである。


Exercise 81問題 81
A survey of the mean number of cents off that coupons give was conducted by randomly surveying one coupon per page from the coupon sections of a recent San Jose Mercury News. The following data were collected: 20¢; 75¢; 50¢; 65¢; 30¢; 55¢; 40¢; 40¢; 30¢; 55¢; $1.50; 40¢; 65¢; 40¢. Assume the underlying distribution is approximately normal.
英語のヒント
クーポンの平均割引額をセント単位で調べるため、最近のSan Jose Mercury News紙のクーポン欄から、各ページ1枚ずつ無作為に選んで調査した。得られたデータは、20セント; 75セント; 50セント; 65セント; 30セント; 55セント; 40セント; 40セント; 30セント; 55セント; 1.50ドル; 40セント; 65セント; 40セントだった。背景の分布は近似的に正規分布と仮定する。
- = __________
- = __________
- n = __________
- n-1 = __________
- Define the random variables and in words.確率変数とを言葉で定義する。
- Which distribution should you use for this problem? Explain your choice.この問題にはどの分布を使うべきか。選んだ理由を説明する。
- Construct a 95% confidence interval for the population mean worth of coupons.クーポンの価値の母平均の95%信頼区間を作れ。
- State the confidence interval.信頼区間を示す。
- Sketch the graph.グラフの概形を描く。
- Calculate the error bound.誤差限界を求める。
- If many random samples were taken of size 14, what percent of the confidence intervals constructed should contain the population mean worth of coupons? Explain why.大きさ14の無作為標本を何度も取ると、作った信頼区間の何%がクーポンの価値の母平均を含むはずか。理由を説明せよ。