第8章信頼区間
Formula Review公式の復習
p′ = x / n where x represents the number of successes and n represents the sample size. The variable p′ is the sample proportion and serves as the point estimate for the true population proportion.
p′ = x/nであり、xは成功回数、nは標本の大きさを表す。変数p′は標本比率であり、真の母比率の点推定値として使われる。
q′ = 1 – p′
The variable has a binomial distribution that can be approximated with the normal distribution shown here.
。変数は二項分布に従い、ここに示した正規分布で近似できる。
EBP = the error bound for a proportion =
EBP = 比率の誤差限界 =
Confidence interval for a proportion:
比率の信頼区間:
(lower bound, upper bound)
(下限, 上限)
provides the number of participants needed to estimate the population proportion with confidence 1 - α and margin of error EBP.
は、信頼水準1 − α、誤差限界EBPで母比率を推定するために必要な参加者数を与える。
Use the normal distribution for a single population proportion
1つの母比率には正規分布を使う。。
The confidence interval has the format ( – EBP, + EBP).
信頼区間の形は( − EBP, + EBP)である。
is a point estimate for μ
はμの点推定値である。
is a point estimate for ρ
はρの点推定値である。
s is a point estimate for σ
sはσの点推定値である。
Exercises 84–85練習問題 84–85
Use the following information to answer the next two exercises: Marketing companies are interested in knowing the population percent of women who make the majority of household purchasing decisions.
次の情報を使って、続く2問に答えよ。マーケティング会社は、家庭の購買の大半を決める女性の母集団での割合を知りたいと考えている。
Exercise 84問題 84
When designing a study to determine this population proportion, what is the minimum number you would need to survey to be 90% confident that the population proportion is estimated to within 0.05?
この母比率を調べる研究を計画する場合、母比率が0.05以内の誤差で推定されることに90%の信頼度を得るには、最低何人を調べる必要があるか。
Exercise 85問題 85
If it were later determined that it was important to be more than 90% confident and a new survey were commissioned, how would it affect the minimum number you need to survey? Why?
英語のヒント
後になって90%を超える信頼度が重要と判断され、新たな調査を依頼された場合、調べる必要がある最小人数はどう変わるか。理由も述べよ。
Solution解き方
The sample size needed would increase. As the confidence level increases, decreases and increases. To maintain the same error bound, the size of the sample needs to increase.
必要な標本の大きさは増える。信頼水準が上がると、は小さくなり、は大きくなる。同じ誤差限界を維持するには、標本を大きくする必要がある。
Exercises 86–90練習問題 86–90
Use the following information to answer the next five exercises: Suppose the marketing company did do a survey. They randomly surveyed 200 households and found that in 120 of them, the woman made the majority of the purchasing decisions. We are interested in the population proportion of households where women make the majority of the purchasing decisions.
英語のヒント
次の情報を使って、続く5問に答えよ。マーケティング会社が実際に調査を行ったとする。200世帯を無作為に調べると、120世帯で購買の大半を女性が決めていた。関心があるのは、女性が購買の大半を決める世帯の母比率である。
Exercise 86問題 86
Identify the following:
次の値を明らかにする:
- x = ______
- n = ______
- = ______
Exercise 87問題 87
Define the random variables X and in words.
確率変数Xとを言葉で定義する。
Solution解き方
X is the number of “successes” where the woman makes the majority of the purchasing decisions for the household. P′ is the percentage of households sampled where the woman makes the majority of the purchasing decisions for the household.
Xは、家庭の購買の大半を女性が決めるという「成功」の数である。P′は、標本の世帯のうち家庭の購買の大半を女性が決める世帯の割合である。
Exercise 88問題 88
Which distribution should you use for this problem?
この問題にはどの分布を使うべきか。
Exercise 89問題 89
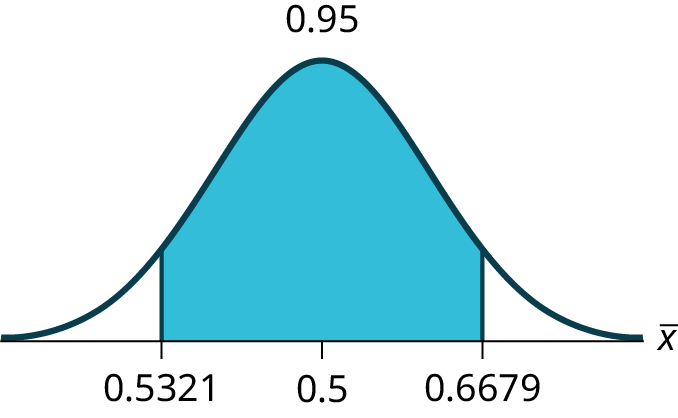
Construct a 95% confidence interval for the population proportion of households where the women make the majority of the purchasing decisions. State the confidence interval, sketch the graph, and calculate the error bound.
女性が購買の大半を決める世帯の母比率の95%信頼区間を作れ。信頼区間を示し、グラフの概形を描き、誤差限界を計算せよ。
Exercise 90問題 90
List two difficulties the company might have in obtaining random results, if this survey were done by email.
この調査を電子メールで行った場合、無作為な結果を得るうえで会社が直面しうる難しさを2つ挙げよ。
Exercises 91–95練習問題 91–95
Use the following information to answer the next five exercises: Of 1,050 randomly selected adults, 360 identified themselves as manual laborers, 280 identified themselves as non-manual wage earners, 250 identified themselves as mid-level managers, and 160 identified themselves as executives. In the survey, 82% of manual laborers preferred trucks, 62% of non-manual wage earners preferred trucks, 54% of mid-level managers preferred trucks, and 26% of executives preferred trucks.
英語のヒント
無作為に選んだ成人1050人のうち、360人が自分を肉体労働者、280人が非肉体労働の賃金労働者、250人が中間管理職、160人が経営幹部と答えた。この調査では、肉体労働者の82%、非肉体労働の賃金労働者の62%、中間管理職の54%、経営幹部の26%がトラックを好んでいた。次の情報を使って、続く5問に答えよ。
Exercise 91問題 91
We are interested in finding the 95% confidence interval for the percent of executives who prefer trucks. Define random variables X and P′ in words.
トラックを好む経営幹部の割合の95%信頼区間を求めたい。確率変数XとP′を言葉で定義せよ。
Solution解き方
X is the number of “successes” where an executive prefers a truck. P′ is the percentage of executives sampled who prefer a truck.
Xは経営幹部がトラックを好むという「成功」の数である。P′は、標本の経営幹部のうちトラックを好む人の割合である。
Exercise 92問題 92
Which distribution should you use for this problem?
この問題にはどの分布を使うべきか。
Exercise 93問題 93
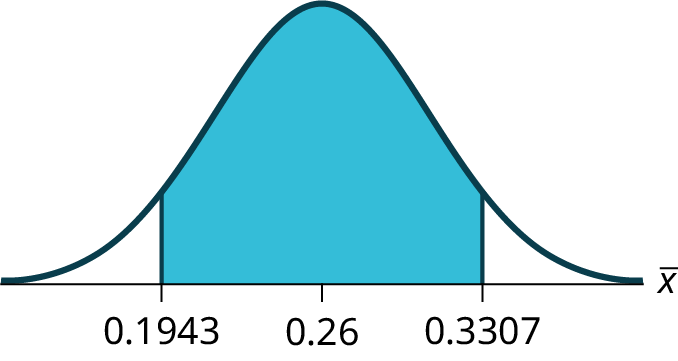
Construct a 95% confidence interval. State the confidence interval, sketch the graph, and calculate the error bound.
95%信頼区間を作れ。信頼区間を示し、グラフの概形を描き、誤差限界を計算せよ。
Exercise 94問題 94
Suppose we want to lower the sampling error. What is one way to accomplish that?
標本誤差を小さくしたいとする。そのための方法を1つ挙げよ。
Exercise 95問題 95
The sampling error given in the survey is ±2%. Explain what the ±2% means.
調査で示された標本誤差は±2%である。この±2%の意味を説明せよ。
Solution解き方
The sampling error means that the true mean can be 2% above or below the sample mean.
この標本誤差は、真の平均が標本平均より2%高いか低い可能性があることを意味する。
Exercises 96–100練習問題 96–100
Use the following information to answer the next five exercises: A poll of 1,200 voters asked what the most significant issue was in the upcoming election. Sixty-five percent answered the economy. We are interested in the population proportion of voters who feel the economy is the most important.
次の情報を使って、続く5問に答えよ。有権者1200人に、次の選挙で最も重要な争点は何かを尋ねたところ、65%が経済と答えた。関心があるのは、経済が最も重要だと考える有権者の母比率である。
Exercise 96問題 96
Define the random variable X in words.
確率変数Xを言葉で定義せよ。
Exercise 97問題 97
Define the random variable P′ in words.
確率変数P′を言葉で定義せよ。
Solution解き方
P′ is the proportion of voters sampled who said the economy is the most important issue in the upcoming election.
P′は、標本の有権者のうち、次の選挙で経済が最も重要な争点だと答えた人の比率である。
Exercise 98問題 98
Which distribution should you use for this problem?
この問題にはどの分布を使うべきか。
Exercise 99問題 99
Construct a 90% confidence interval, and state the confidence interval and the error bound.
90%信頼区間を作り、信頼区間と誤差限界を示せ。
Solution解き方
CI: (0.62735, 0.67265)
信頼区間:(0.62735, 0.67265)
EBM: 0.02265
EBM:0.02265
Exercise 100問題 100
What would happen to the confidence interval if the level of confidence were 95%?
信頼水準が95%だったら、信頼区間はどうなるか。
Exercises 101–116練習問題 101–116
Use the following information to answer the next 16 exercises: The Ice Chalet offers dozens of different beginning ice-skating classes. All of the class names are put into a bucket. The 5 P.M., Monday night, ages 8 to 12, beginning ice-skating class was picked. In that class were 64 girls and 16 boys. Suppose that we are interested in the true proportion of girls, ages 8 to 12, in all beginning ice-skating classes at the Ice Chalet. Assume that the children in the selected class are a random sample of the population.
次の情報を使って、続く16問に答えよ。アイス・シャレーには数十種類の初心者向けアイススケート教室がある。全クラスの名前をバケツに入れて選ぶと、月曜午後5時、8~12歳向けの初心者クラスが当たった。そのクラスには女子64人、男子16人がいた。関心があるのは、アイス・シャレーの8~12歳向け初心者クラス全体での女子の真の比率である。選ばれたクラスの子どもたちは、母集団の無作為標本であると仮定する。
Exercise 101問題 101
What is being counted?
何を数えているか。
Solution解き方
The number of girls, ages 8 to 12, in the 5 P.M. Monday night beginning ice-skating class.
月曜午後5時の初心者向けスケート教室にいる、8~12歳の女子の人数。
Exercise 102問題 102
In words, define the random variable X.
確率変数Xを言葉で定義する。
Exercise 103問題 103
Calculate the following:
次の値を求める:
- x = _______
- n = _______
- p′ = _______
Solution解き方
- x = 64
- n = 80
- p′ = 0.8
Exercise 104問題 104
State the estimated distribution of X. X~________
Xの推定される分布を示せ。X ~ ________
Exercise 105問題 105
Define a new random variable P′. What is p′ estimating?
新しい確率変数P′を定義せよ。p′は何を推定しているか。
Solution解き方
p
Exercise 106問題 106
In words, define the random variable P′.
確率変数P′を言葉で定義せよ。
Exercise 107問題 107
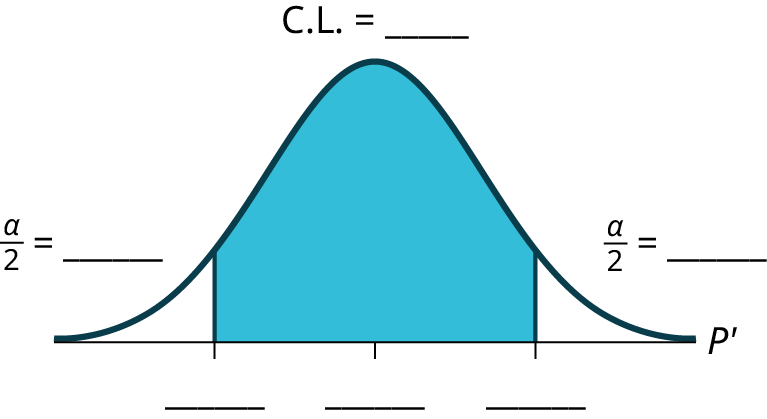
State the estimated distribution of P′. Construct a 92% Confidence Interval for the true proportion of girls in the ages 8 to 12 beginning ice-skating classes at the Ice Chalet.
P′の推定される分布を示せ。アイス・シャレーの8~12歳向け初心者スケート教室における女子の真の比率の92%信頼区間を作れ。
Solution解き方
. (0.72171, 0.87829).
Exercise 108問題 108
How much area is in both tails (combined)?
両裾の面積の合計はいくらか。
Exercise 109問題 109
How much area is in each tail?
各裾の面積はいくらか。
Solution解き方
0.04
Exercise 110問題 110
Calculate the following:
次の値を求める:
- lower limit下限
- upper limit上限
- error bound誤差限界
Exercise 111問題 111
The 92% confidence interval is _______.
92%信頼区間は_______である。
Solution解き方
(0.72; 0.88)
Exercise 112問題 112


Exercise 113問題 113
In one complete sentence, explain what the interval means.
完全な1文で、この区間が何を意味するか説明する。
Solution解き方
With 92% confidence, we estimate the proportion of girls, ages 8 to 12, in a beginning ice-skating class at the Ice Chalet to be between 72% and 88%.
アイス・シャレーの8~12歳向け初心者スケート教室での女子の比率は72%から88%の間にあると、92%の信頼度で推定する。
Exercise 114問題 114
Using the same p′ and level of confidence, suppose that n were increased to 100. Would the error bound become larger or smaller? How do you know?
p′と信頼水準は同じにして、nを100に増やしたとする。誤差限界は大きくなるか、小さくなるか。どのように分かるか。
Exercise 115問題 115
Using the same p′ and n = 80, how would the error bound change if the confidence level were increased to 98%? Why?
p′とn = 80は同じにして、信頼水準を98%に上げると、誤差限界はどう変わるか。理由も述べよ。
Solution解き方
The error bound would increase. Assuming all other variables are kept constant, as the confidence level increases, the area under the curve corresponding to the confidence level becomes larger, which creates a wider interval and thus a larger error.
英語のヒント
誤差限界は大きくなる。ほかのすべての変数を一定とすると、信頼水準が上がるほど、それに対応する曲線の下の面積も大きくなる。そのため区間が広がり、誤差も大きくなる。
Exercise 116問題 116
If you decreased the allowable error bound, why would the minimum sample size increase (keeping the same level of confidence)?
英語のヒント
許容する誤差限界を小さくすると、なぜ必要な最小標本数が増えるのか。信頼水準は同じとする。