第5章積分
Applying the Net Change Theorem正味の変化の定理の応用
The net change theorem can be applied to the flow and consumption of fluids, as shown in Example 5.26.
正味の変化の定理は、例題5.26のように、液体の流れや消費にも適用できる。
Example 5.26例題 5.26
How Many Gallons of Gasoline Are Consumed?ガソリンは何ガロン消費されるか
If the motor on a motorboat is started at and the boat consumes gasoline at the rate of gal/hr, how much gasoline is used in the first 2 hours?
モーターボートのエンジンを に始動し、ガソリンを ガロン毎時の割合で消費するとする。最初の2時間で何ガロン使うか。
Solution解き方
Express the problem as a definite integral, integrate, and evaluate using the Fundamental Theorem of Calculus. The limits of integration are the endpoints of the interval We have
問題を定積分で表し、微積分の基本定理で計算する。積分区間の端点は の両端である。すると、
Thus, the motorboat uses 9.6 gal of gas in 2 hours.
したがって、2時間で9.6ガロンのガソリンを使う。
Example 5.27例題 5.27
Chapter Opener: Iceboats章の導入:アイスボート
Image omitted because its reuse rights could not be verified.権利の確認ができないため画像を割愛。
Figure 5.34図 5.34
(credit: modification of work by Carter Brown, Flickr)
(Carter Brownによる作品を改変、Flickr)
As we saw at the beginning of the chapter, top iceboat racers (Figure 5.1) can attain speeds of up to five times the wind speed. Andrew is an intermediate iceboater, though, so he attains speeds equal to only twice the wind speed. Suppose Andrew takes his iceboat out one morning when a light 5-mph breeze has been blowing all morning. As Andrew gets his iceboat set up, though, the wind begins to pick up. During his first half hour of iceboating, the wind speed increases according to the function For the second half hour of Andrew’s outing, the wind remains steady at 15 mph. In other words, the wind speed is given by
英語のヒント
章の冒頭で見たように、優れたアイスボート競技者は風速の5倍もの速さに達する(図5.1)。アンドリューは中級者であり、出せる速さは風速の2倍とする。ある朝、時速5マイルのそよ風が吹き続けている中、アンドリューがアイスボートの準備を始めると、風が強まり始めた。走り始めてから最初の30分間、風速は に従って増え、次の30分間は時速15マイルで一定になった。つまり、風速は次式で与えられる。
Recalling that Andrew’s iceboat travels at twice the wind speed, and assuming he moves in a straight line away from his starting point, how far is Andrew from his starting point after 1 hour?
アイスボートは風速の2倍で進むことを思い出そう。出発点から一直線に離れていくとすると、1時間後にアンドリューは出発点からどれだけ離れているか。
Solution解き方
To figure out how far Andrew has traveled, we need to integrate his velocity, which is twice the wind speed. Then
移動距離を求めるには、風速の2倍であるボートの速度を積分する。したがって、
Distance
距離
Substituting the expressions we were given for we get
与えられた の式を代入すると、
Andrew is 25 mi from his starting point after 1 hour.
1時間後には、出発点から25マイル離れている。
Integrating Even and Odd Functions偶関数と奇関数の積分
We saw in Functions and Graphs that an even function is a function in which for all x in the domain—that is, the graph of the curve is unchanged when x is replaced with −x. The graphs of even functions are symmetric about the y-axis. An odd function is one in which for all x in the domain, and the graph of the function is symmetric about the origin.
英語のヒント
「関数とグラフ」で、定義域のすべての x について となる関数を偶関数と呼んだ。x を −x に置き換えても関数値が変わらず、そのグラフは y 軸に関して対称である。奇関数は、定義域のすべての x について となる関数であり、グラフは原点に関して対称である。
Integrals of even functions, when the limits of integration are from −a to a, involve two equal areas, because they are symmetric about the y-axis. Integrals of odd functions, when the limits of integration are similarly evaluate to zero because the areas above and below the x-axis are equal.
偶関数を −a から a まで積分すると、y 軸について対称な二つの等しい符号付き面積を足すことになる。一方、奇関数を区間 で積分すると、軸より上と下の面積が打ち消し合って0になる。
Example 5.28例題 5.28
Integrating an Even Function偶関数を積分する
Integrate the even function and verify that the integration formula for even functions holds.
偶関数の積分 を求め、偶関数の積分公式が成り立つことを確かめよ。
Solution解き方
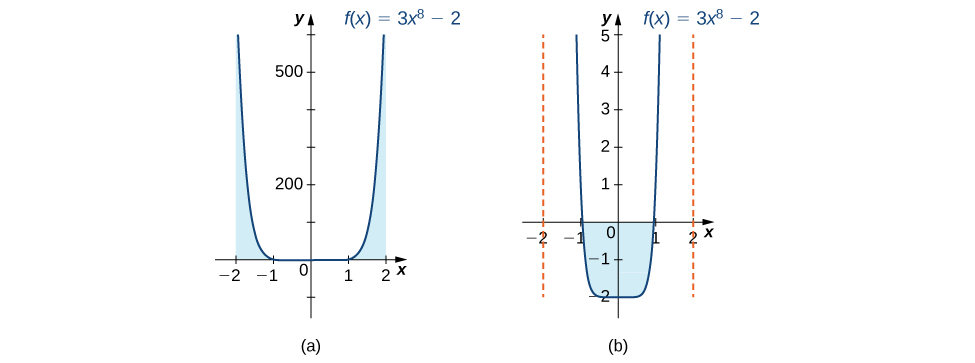
The symmetry appears in the graphs in Figure 5.35. Graph (a) shows the region below the curve and above the x-axis. We have to zoom in to this graph by a huge amount to see the region. Graph (b) shows the region above the curve and below the x-axis. The signed area of this region is negative. Both views illustrate the symmetry about the y-axis of an even function. We have
図5.35にグラフの対称性を示す。(a) は曲線より下かつ x 軸より上の領域を示し、(b) は原点付近を拡大して、曲線より上かつ x 軸より下の領域を示している。この下側の領域の符号付き面積は負である。どちらの表示からも、偶関数の y 軸に関する対称性がわかる。したがって、
To verify the integration formula for even functions, we can calculate the integral from 0 to 2 and double it, then check to make sure we get the same answer.
偶関数の積分公式を確かめるには、0から2まで積分した値を2倍し、同じ答えになるか確認すればよい。
Since we have verified the formula for even functions in this particular example.
なので、この例で偶関数の公式が確かめられた。
OpenStax, Rice University; Calculus Volume 1. · CC BY-NC-SA 4.0
Figure 5.35図 5.35
Graph (a) shows the positive area between the curve and the x-axis, whereas graph (b) shows the negative area between the curve and the x-axis. Both views show the symmetry about the y-axis.
(a) は曲線と x 軸の間の正の符号付き面積、(b) は負の符号付き面積を示す。どちらも y 軸に関する対称性を示している。
Example 5.29例題 5.29
Integrating an Odd Function奇関数を積分する
Evaluate the definite integral of the odd function over the interval
区間 上で、奇関数 の定積分を求めよ。
Solution解き方
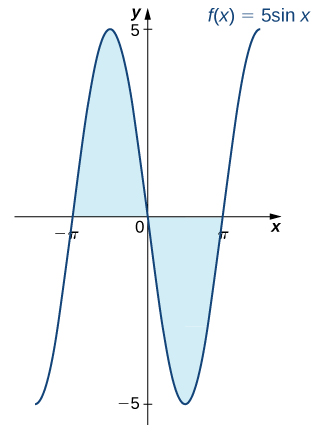
The graph is shown in Figure 5.36. We can see the symmetry about the origin by the positive area above the x-axis over and the negative area below the x-axis over We have
図5.36にグラフを示す。区間 で x 軸より上の正の符号付き面積と、区間 で x 軸より下の負の符号付き面積から、原点に関する対称性がわかる。したがって、
OpenStax, Rice University; Calculus Volume 1. · CC BY-NC-SA 4.0
Figure 5.36図 5.36
The graph shows areas between a curve and the x-axis for an odd function.
奇関数の曲線と x 軸に挟まれた領域を示している。