第5章積分
Key Concepts重要な概念
- The use of sigma (summation) notation of the form is useful for expressing long sums of values in compact form.という形のシグマ記法(和の記法)は、多くの数値の和を簡潔に表すのに役立つ。
- For a continuous function defined over an interval the process of dividing the interval into n equal parts, extending a rectangle to the graph of the function, calculating the areas of the series of rectangles, and then summing the areas yields an approximation of the area of that region.区間 上で定義された連続関数について、区間を n 等分し、各小区間から関数のグラフまで長方形を伸ばす。それぞれの面積を計算して足し合わせると、その領域の面積を近似できる。
- The width of each rectangle is各長方形の幅は である。
- Riemann sums are expressions of the form and can be used to estimate the area under the curve Left- and right-endpoint approximations are special kinds of Riemann sums where the values of are chosen to be the left or right endpoints of the subintervals, respectively.リーマン和は という形の式であり、曲線 の下の面積の見積もりに使える。左端近似と右端近似は、それぞれ を各小区間の左端または右端に選んだ、リーマン和の特別な場合である。
- Riemann sums allow for much flexibility in choosing the set of points at which the function is evaluated, often with an eye to obtaining a lower sum or an upper sum.
英語のヒント
リーマン和では、関数値を求める点の集合 をかなり自由に選べる。下和や上和を得ることを目的として選ぶ場合も多い。
Key Equations重要な式
Properties of Sigma Notation シグマ記法の性質 |
|
Sums and Powers of Integers 整数とその累乗の和 |
|
Left-Endpoint Approximation 左端近似 |
|
Right-Endpoint Approximation 右端近似 |
Exercises 1練習問題 1
Exercise 1問題 1
State whether the given sums are equal or unequal.
与えられた二つの和が等しいか、等しくないかを答えよ。
- andおよび 。
- andおよび 。
- andおよび 。
- andおよび 。
Solution解き方
a. They are equal; both represent the sum of the first 10 whole numbers. b. They are equal; both represent the sum of the first 10 whole numbers. c. They are equal by substituting d. They are equal; the first sum factors the terms of the second.
a. 等しい。どちらも1から10までの整数の和を表す。b. 等しい。どちらも1から10までの整数の和を表す。c. と置き換えれば、等しいことがわかる。d. 等しい。最初の和は、2番目の和の各項を因数分解した形になっている。
Exercises 2–3練習問題 2–3
In the following exercises, use the rules for sums of powers of integers to compute the sums.
次の各問では、整数の累乗の和の公式を使って、和を求めよ。
Exercise 2問題 2
Exercise 3問題 3
Solution解き方
Exercises 4–7練習問題 4–7
Suppose that and In the following exercises, compute the sums.
および とする。次の各問の和を求めよ。
Exercise 4問題 4
Exercise 5問題 5
Solution解き方
Exercise 6問題 6
Exercise 7問題 7
Solution解き方
Exercises 8–11練習問題 8–11
In the following exercises, use summation properties and formulas to rewrite and evaluate the sums.
次の各問では、総和の性質と公式を使って式を書き換え、和の値を求めよ。
Exercise 8問題 8
Exercise 9問題 9
Solution解き方
Exercise 10問題 10
Exercise 11問題 11
Solution解き方
Exercises 12–23練習問題 12–23
Let denote the left-endpoint sum using n subintervals and let denote the corresponding right-endpoint sum. In the following exercises, compute the indicated left and right sums for the given functions on the indicated interval.
n 個の小区間を使った左端和を 、対応する右端和を とする。次の各問では、指定された区間と関数について、指示された左端和と右端和を求めよ。
Exercise 12問題 12
L4 for on
区間 の に対する左端和 L4。
Exercise 13問題 13
R4 for on
区間 の に対する右端和 R4。
Solution解き方
Exercise 14問題 14
L6 for on
区間 の に対する左端和 L6。
Exercise 15問題 15
R6 for on
区間 の に対する右端和 R6。
Solution解き方
Exercise 16問題 16
R4 for on
区間 の に対する右端和 R4。
Exercise 17問題 17
L4 for on
区間 の に対する左端和 L4。
Solution解き方
Exercise 18問題 18
R8 for on
区間 の に対する右端和 R8。
Exercise 19問題 19
L8 for on
区間 の に対する左端和 L8。
Solution解き方
Exercise 20問題 20
Compute the left and right Riemann sums—L4 and R4, respectively—for on Compute their average value and compare it with the area under the graph of f.
区間 上の について、左端を用いたリーマン和 L4 と右端を用いたリーマン和 R4 を求めよ。その二つの平均を計算し、f のグラフの下の面積と比較せよ。
Exercise 21問題 21
Compute the left and right Riemann sums—L6 and R6, respectively—for on Compute their average value and compare it with the area under the graph of f.
区間 上の について、左端を用いたリーマン和 L6 と右端を用いたリーマン和 R6 を求めよ。その二つの平均を計算し、f のグラフの下の面積と比較せよ。
Solution解き方
The graph of f is a triangle with area 9.
。f のグラフと軸で囲まれる領域は、面積9の三角形である。
Exercise 22問題 22
Compute the left and right Riemann sums—L4 and R4, respectively—for on and compare their values.
区間 上の について、左端を用いたリーマン和 L4 と右端を用いたリーマン和 R4 を求め、その値を比較せよ。
Exercise 23問題 23
Compute the left and right Riemann sums—L6 and R6, respectively—for on and compare their values.
区間 上の について、左端を用いたリーマン和 L6 と右端を用いたリーマン和 R6 を求め、その値を比較せよ。
Solution解き方
They are equal.
。両者は等しい。
Exercises 24–27練習問題 24–27
Express the following endpoint sums in sigma notation but do not evaluate them.
次の端点和をシグマ記法で表せ。ただし、その値を計算する必要はない。
Exercise 24問題 24
L30 for on
区間 の に対する左端和 L30。
Exercise 25問題 25
L10 for on
区間 の に対する左端和 L10。
Solution解き方
Exercise 26問題 26
R20 for on
区間 の に対する右端和 R20。
Exercise 27問題 27
R100 for on
区間 の に対する右端和 R100。
Solution解き方
Exercises 28–41練習問題 28–41
In the following exercises, graph the function then use a calculator or a computer program to evaluate the following left and right endpoint sums. If the two agree, say "neither."
次の各問では関数のグラフを描き、電卓またはコンピュータープログラムを使って、指定された左端和と右端和を求めよ。二つの値が一致する場合は「どちらでもない」と答えよ。
Exercise 28問題 28
[T] L100 and R100 for on the interval
[T] 区間 の に対する左端和 L100 と右端和 R100。
Exercise 29問題 29
[T] L100 and R100 for on the interval
[T] 区間 の に対する左端和 L100 と右端和 R100。
Solution解き方
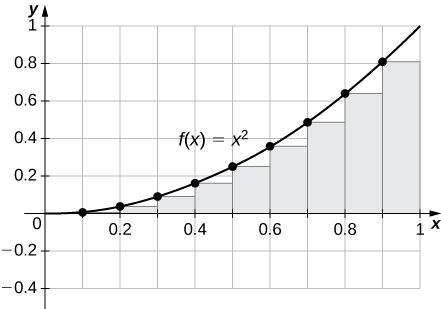
OpenStax, Rice University; Calculus Volume 1. · CC BY-NC-SA 4.0
The plot shows that the left Riemann sum is an underestimate because the function is increasing. Similarly, the right Riemann sum is an overestimate. The area lies between the left and right Riemann sums. Ten rectangles are shown for visual clarity. This behavior persists for more rectangles.
英語のヒント
。関数が増加するため、左端を用いたリーマン和は過小評価となり、右端を用いたリーマン和は過大評価となる。求める面積は、その二つの値の間にある。図では見やすさのため長方形を10個だけ示している。数を増やしても、この性質は変わらない。
Exercise 30問題 30
[T] L50 and R50 for on the interval
[T] 区間 の に対する左端和 L50 と右端和 R50。
Exercise 31問題 31
[T] L100 and R100 for on the interval
[T] 区間 の に対する左端和 L100 と右端和 R100。
Solution解き方
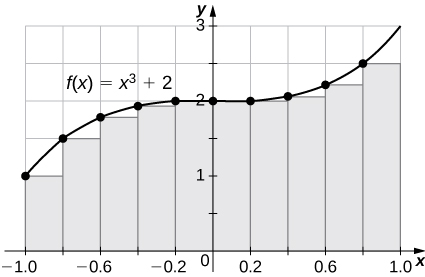
OpenStax, Rice University; Calculus Volume 1. · CC BY-NC-SA 4.0
The left endpoint sum is an underestimate because the function is increasing. Similarly, a right endpoint approximation is an overestimate. The area lies between the left and right endpoint estimates.
。関数が増加するため、左端和は過小評価になる。同様に、右端近似は過大評価になる。面積は左端近似と右端近似の間にある。
Exercise 32問題 32
[T] L50 and R50 for on the interval
[T] 区間 の に対する左端和 L50 と右端和 R50。
Exercise 33問題 33
[T] L100 and R100 for on the interval
[T] 区間 の に対する左端和 L100 と右端和 R100。
Solution解き方
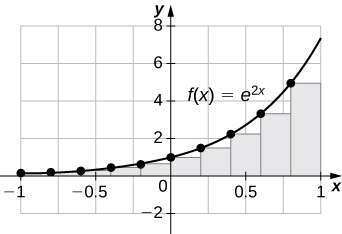
OpenStax, Rice University; Calculus Volume 1. · CC BY-NC-SA 4.0
The plot shows that the left Riemann sum is an underestimate because the function is increasing. Ten rectangles are shown for visual clarity. This behavior persists for more rectangles.
。関数が増加するため、図の左端リーマン和は過小評価となる。図では見やすさのため長方形を10個だけ示しているが、数を増やしてもこの性質は続く。
Exercise 34問題 34
Let tj denote the time that it took Tejay van Garteren to ride the jth stage of the Tour de France in 2014. If there were a total of 21 stages, interpret
2014年のツール・ド・フランスで、ティージェイ・ヴァンガーデレンが第 j ステージを走るのに要した時間を tj とする。全21ステージであったとき、 は何を表すか。
Exercise 35問題 35
Let denote the total rainfall in Portland on the jth day of the year in 2009. Interpret
2009年の第 j 日にポートランドで観測された総降水量を とする。 は何を表すか。
Solution解き方
The sum represents the cumulative rainfall in January 2009.
英語のヒント
2009年1月の総降水量を表す。
Exercise 36問題 36
Let denote the hours of daylight and denote the increase in the hours of daylight from day to day j in Fargo, North Dakota, on the jth day of the year. Interpret
ノースダコタ州ファーゴにおける、その年の第 j 日の日照時間を とし、第 日から第 j 日への日照時間の増加量を とする。 は何を表すか。
Exercise 37問題 37
To help get in shape, Joe gets a new pair of running shoes. If Joe runs 1 mi each day in week 1 and adds mi to his daily routine each week, what is the total mileage on Joe’s shoes after 25 weeks?
英語のヒント
ジョーは体を鍛えるために、新しいランニングシューズを買った。第1週には毎日1マイル走り、その後は1日の走行距離を毎週 マイルずつ増やす。25週間後、靴で走った総距離はいくらになるか。
Solution解き方
The total mileage is
総走行距離は である。
Exercise 38問題 38
The following table gives approximate values of the average annual atmospheric rate of increase in carbon dioxide (CO2) each decade since 1960, in parts per million (ppm). Estimate the total increase in atmospheric CO2 between 1964 and 2013.
次の表は、1960年代以降の各10年間について、大気中の二酸化炭素(CO2)濃度の年平均増加量を、おおよその ppm 値で示している。1964年から2013年までの大気中の CO2 濃度の総増加量を見積もれ。
Decade 10年間の区分 |
Ppm/y ppm/年 |
|---|---|
1964–1973 |
1.07 |
1974–1983 |
1.34 |
1984–1993 |
1.40 |
1994–2003 |
1.87 |
2004–2013 |
2.07 |
Exercise 39問題 39
The following table gives the approximate increase in sea level in inches over 20 years starting in the given year. Estimate the net change in mean sea level from 1870 to 2010.
次の表は、指定された年から始まる20年間の海面上昇量を、おおよそのインチ値で示している。1870年から2010年までの平均海面の正味の変化を見積もれ。
Starting Year 開始年 |
20-Year Change 20年間の変化量 |
|---|---|
1870 |
0.3 |
1890 |
1.5 |
1910 |
0.2 |
1930 |
2.8 |
1950 |
0.7 |
1970 |
1.1 |
1990 |
1.5 |
Solution解き方
Add the numbers to get 8.1-in. net increase.
表の数値を足すと、正味の上昇量は8.1インチとなる。
Exercise 40問題 40
The following table gives the approximate increase in dollars in the average price of a gallon of gas per decade since 1950. If the average price of a gallon of gas in 2010 was $2.60, what was the average price of a gallon of gas in 1950?
次の表は、1950年以降の各10年間について、ガソリン1ガロンの平均価格の増加額を、おおよそのドル値で示している。2010年の平均価格が1ガロン当たり2.60ドルだったとすると、1950年の平均価格はいくらだったか。
Starting Year 開始年 |
10-Year Change 10年間の変化額 |
|---|---|
1950 |
0.03 |
1960 |
0.05 |
1970 |
0.86 |
1980 |
−0.03 |
1990 |
0.29 |
2000 |
1.12 |
Exercise 41問題 41
The following table gives the percent growth of the U.S. population beginning in July of the year indicated. If the U.S. population was 281,421,906 in July 2000, estimate the U.S. population in July 2010.
次の表は、指定された年の7月から1年間の米国人口増加率を示している。2000年7月の米国人口が281,421,906人だったとすると、2010年7月の人口を見積もれ。
Year 年 |
% Change/Year 年間増加率(%) |
|---|---|
2000 |
1.12 |
2001 |
0.99 |
2002 |
0.93 |
2003 |
0.86 |
2004 |
0.93 |
2005 |
0.93 |
2006 |
0.97 |
2007 |
0.96 |
2008 |
0.95 |
2009 |
0.88 |
(Hint: To obtain the population in July 2001, multiply the population in July 2000 by 1.0112 to get 284,573,831.)
(ヒント:2001年7月の人口を求めるには、2000年7月の人口に1.0112を掛ける。284,573,831人となる。)
Solution解き方
309,389,957
309,389,957