第5章積分
Comparison Properties of Integrals積分の大小関係
A picture can sometimes tell us more about a function than the results of computations. Comparing functions by their graphs as well as by their algebraic expressions can often give new insight into the process of integration. Intuitively, we might say that if a function is above another function then the area between and the x-axis is greater than the area between and the x-axis. This is true depending on the interval over which the comparison is made. The properties of definite integrals are valid whether or The following properties, however, concern only the case and are used when we want to compare the sizes of integrals.
英語のヒント
計算結果より、図のほうが関数の性質をよく伝えることもある。式だけでなくグラフでも関数を比較すると、積分への理解が深まることが多い。直感的には、関数 が別の関数 より上にあれば、 と x 軸の間の面積のほうが、 と x 軸の間の面積より大きいと考えられる。この関係では、比較する区間の端点の順序が重要である。先ほどの定積分の性質は、 の場合も の場合も成り立つ。一方、次の性質は の場合を対象とし、積分の大小を比較するために使う。
Example 5.13例題 5.13
Comparing Two Functions over a Given Interval指定された区間で二つの関数を比較する
Compare and over the interval
区間 上で、 と を比較せよ。
Solution解き方
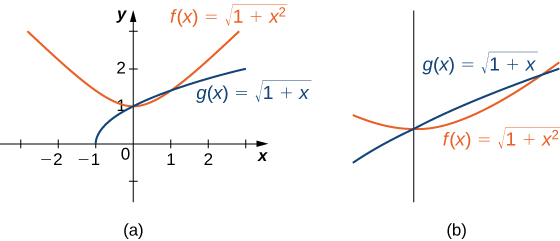
Graphing these functions is necessary to understand how they compare over the interval Initially, when graphed on a graphing calculator, appears to be above everywhere. However, on the interval the graphs appear to be on top of each other. We need to zoom in to see that, on the interval is above The two functions intersect at and (Figure 5.23).
区間 で二つの関数の大小を理解するために、グラフを描こう。最初にグラフ電卓で描くと、 がどこでも より上にあるように見える。しかし、区間 ではグラフが重なっているように見える。拡大すると、 が より上にあることがわかる。二つの関数は と で交わる(図5.23)。
OpenStax, Rice University; Calculus Volume 1. · CC BY-NC-SA 4.0
Figure 5.23図 5.23
(a) The function appears above the function except over the interval (b) Viewing the same graph with a greater zoom shows this more clearly.
(a) 区間 を除くと、関数 が より上にあるように見える。(b) 同じグラフを拡大すると、この関係がわかりやすくなる。
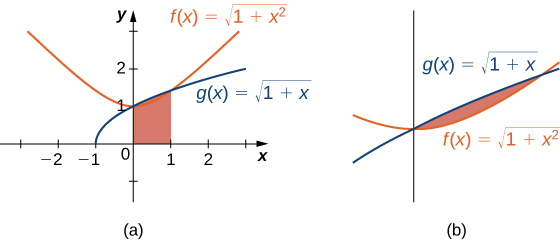
We can see from the graph that over the interval Comparing the integrals over the specified interval we also see that (Figure 5.24). The thin, red-shaded area shows just how much difference there is between these two integrals over the interval
グラフから がわかる。指定された区間 で積分を比較しても、 が成り立つ(図5.24)。薄い赤色の領域は、区間 上の二つの積分の差を表している。
OpenStax, Rice University; Calculus Volume 1. · CC BY-NC-SA 4.0
Figure 5.24図 5.24
(a) The graph shows that over the interval where equality holds only at the endpoints of the interval. (b) Viewing the same graph with a greater zoom shows this more clearly.
(a) グラフから がわかり、等号が成り立つのは区間の両端だけである。(b) 同じグラフを拡大すると、この関係がわかりやすくなる。
Average Value of a Function関数の平均値
We often need to find the average of a set of numbers, such as an average test grade. Suppose you received the following test scores in your algebra class: 89, 90, 56, 78, 100, and 69. Your semester grade is your average of test scores and you want to know what grade to expect. We can find the average by adding all the scores and dividing by the number of scores. In this case, there are six test scores. Thus,
試験の平均点など、いくつかの数の平均を求める場面は多い。代数の授業で、89、90、56、78、100、69という点数を取ったとする。学期の成績がその平均で決まるので、結果を知りたい。平均は、すべての点数を足し、点数の個数で割れば求まる。今回は6回分なので、
Therefore, your average test grade is approximately 80.33, which translates to a B− at most schools.
英語のヒント
したがって、試験の平均点は約80.33点であり、多くの学校では B− に相当する。
Suppose, however, that we have a function that gives us the speed of an object at any time t, and we want to find the object’s average speed. The function takes on an infinite number of values, so we can’t use the process just described. Fortunately, we can use a definite integral to find the average value of a function such as this.
今度は、任意の時刻 t における物体の速さを関数 が与え、その平均の速さを知りたいとしよう。関数 は無数の値をとるので、いま述べた計算法をそのまま使うことはできない。幸い、このような関数の平均値は、定積分を使って求められる。
Let be continuous over the interval and let be divided into n subintervals of width Choose a representative in each subinterval and calculate for In other words, consider each as a sampling of the function over each subinterval. The average value of the function may then be approximated as
英語のヒント
は区間 上で連続であるとする。 を、幅 の n 個の小区間に分ける。各小区間から代表点 を選び、 について を求める。つまり、各 を、その小区間で関数を標本化した値と考える。すると、関数の平均値は次のように近似できる。
which is basically the same expression used to calculate the average of discrete values.
これは基本的に、離散的な値の平均を求める式と同じである。
But we know so and we get
ここで なので である。したがって、
Following through with the algebra, the numerator is a sum that is represented as and we are dividing by a fraction. To divide by a fraction, invert the denominator and multiply. Thus, an approximate value for the average value of the function is given by
英語のヒント
式を整理すると、分子は という和であり、それを分数で割る形になる。分数で割るには、分母の分数を逆数にして掛ければよい。したがって、関数の平均値の近似値は次式で与えられる。
This is a Riemann sum. Then, to get the exact average value, take the limit as n goes to infinity. Thus, the average value of a function is given by
これはリーマン和である。正確な平均値を得るために、n を無限大へ近づける極限をとる。したがって、関数の平均値は次式で与えられる。
Example 5.14例題 5.14
Finding the Average Value of a Linear Function一次関数の平均値を求める
Find the average value of over the interval
区間 上での の平均値を求めよ。
Solution解き方
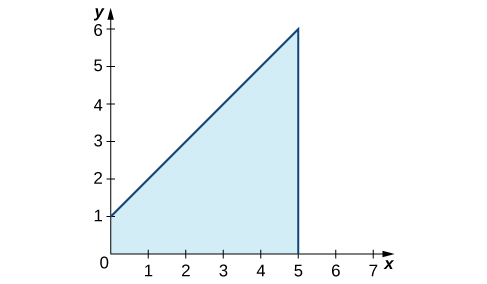
First, graph the function on the stated interval, as shown in Figure 5.25.
まず図5.25のように、指定された区間で関数のグラフを描く。
OpenStax, Rice University; Calculus Volume 1. · CC BY-NC-SA 4.0
Figure 5.25図 5.25
The graph shows the area under the function over
区間 上で、関数 の下にある領域を示している。
The region is a trapezoid lying on its side, so we can use the area formula for a trapezoid where h represents height, and a and b represent the two parallel sides. Then,
この領域は横向きの台形なので、面積公式 を使える。h は高さ、a と b は平行な二辺の長さを表す。すると、
Thus the average value of the function is
したがって、関数の平均値は、