第5章積分
Exercises 42–48練習問題 42–48
In the following exercises, estimate the areas under the curves by computing the left Riemann sums, L8.
次の各問では、左端を用いたリーマン和 L8 を計算し、曲線の下の面積を見積もれ。
Exercise 42問題 42
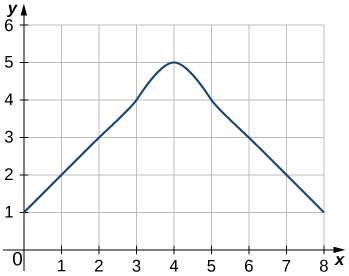
OpenStax, Rice University; Calculus Volume 1. · CC BY-NC-SA 4.0
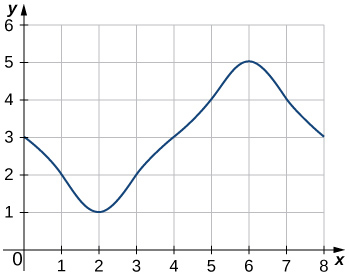
Exercise 44問題 44
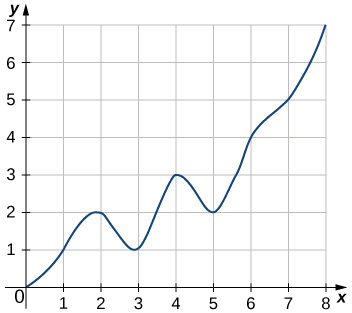
OpenStax, Rice University; Calculus Volume 1. · CC BY-NC-SA 4.0
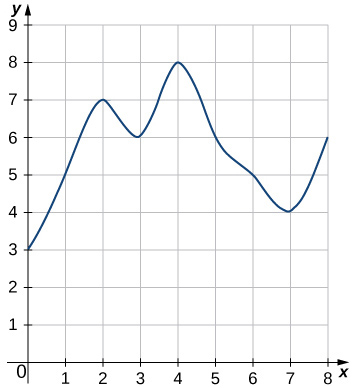
Exercise 46問題 46
[T] Use a computer algebra system to compute the Riemann sum, for for on
[T] 区間 上の について、 としたリーマン和 を数式処理システムで計算せよ。
Exercise 47問題 47
[T] Use a computer algebra system to compute the Riemann sum, LN, for for on
[T] 区間 上の について、 としたリーマン和 LN を数式処理システムで計算せよ。
Solution解き方
Exercise 48問題 48
[T] Use a computer algebra system to compute the Riemann sum, LN, for for on Compare these estimates with π.
[T] 区間 上の について、 としたリーマン和 LN を数式処理システムで計算せよ。これらの近似値を π と比較せよ。
Exercises 49–50練習問題 49–50
In the following exercises, use a calculator or a computer program to evaluate the endpoint sums RN and LN for How do these estimates compare with the exact answers, which you can find via geometry?
次の各問では、電卓またはコンピュータープログラムを使い、 に対する右端和 RN と左端和 LN を計算せよ。幾何学的に求められる正確な答えと比べて、これらの近似値はどうなっているか。
Exercise 49問題 49
[T] on the interval
[T] 区間 上の 。
Solution解き方
and By symmetry of the graph, the exact area is zero.
および 。グラフの対称性から、符号を含めた正確な面積は0である。
Exercise 50問題 50
[T] on the interval
[T] 区間 上の 。
Exercises 51–59練習問題 51–59
In the following exercises, use a calculator or a computer program to evaluate the endpoint sums RN and LN for
次の各問では、電卓またはコンピュータープログラムを使って、 に対する右端和 RN と左端和 LN を計算せよ。
Exercise 51問題 51
[T] on the interval which has an exact area of
[T] 区間 上の 。正確な面積は である。
Solution解き方
Exercise 52問題 52
[T] on the interval which has an exact area of
[T] 区間 上の 。正確な面積は である。
Exercise 53問題 53
Explain why, if and f is increasing on that the left endpoint estimate is a lower bound for the area below the graph of f on
で、f が区間 上で増加するとき、左端近似が区間 における f のグラフの下の面積の下界となる理由を説明せよ。
Solution解き方
If is a subinterval of under one of the left-endpoint sum rectangles, then the area of the rectangle contributing to the left-endpoint estimate is But, for so the area under the graph of f between c and d is plus the area below the graph of f but above the horizontal line segment at height which is positive. As this is true for each left-endpoint sum interval, it follows that the left Riemann sum is less than or equal to the area below the graph of f on
左端和の一つの長方形の底辺となる、 の小区間 を考える。この長方形の面積は である。 では なので、c から d までのグラフの下の面積は、 に、高さ の水平線分より上かつ f のグラフより下の部分の面積を加えたものになる。この追加部分の面積は負ではない。各小区間で同じことが成り立つため、左端を用いたリーマン和は、区間 上で f のグラフの下にある面積以下となる。
Exercise 54問題 54
Explain why, if and f is decreasing on that the left endpoint estimate is an upper bound for the area below the graph of f on
で、f が区間 上で減少するとき、左端近似が区間 における f のグラフの下の面積の上界となる理由を説明せよ。
Exercise 55問題 55
Show that, in general,
一般に が成り立つことを示せ。
Solution解き方
and The left sum has a term corresponding to and the right sum has a term corresponding to In any term corresponding to occurs once with a plus sign and once with a minus sign, so each such term cancels and one is left with
および である。左端和には に対応する項があり、右端和には に対応する項がある。 を計算すると、 に対応する各項は、正の符号で1回、負の符号で1回ずつ現れるため、相殺される。したがって、残るのは である。
Exercise 56問題 56
Explain why, if f is increasing on the error between either LN or RN and the area A below the graph of f is at most
f が区間 上で増加するとき、LN または RN と、f のグラフの下の面積 A との差の大きさが、最大でも となる理由を説明せよ。
Exercise 57問題 57
For each of the three graphs:
次の三つのグラフそれぞれについて答えよ。
- Obtain a lower bound for the area enclosed by the curve by adding the areas of the squares enclosed completely by the curve.曲線の内側に完全に含まれる正方形の面積を足し、曲線で囲まれた面積の下界 を求めよ。
- Obtain an upper bound for the area by adding to the areas of the squares enclosed partially by the curve.一部が曲線の内側に入る正方形の面積 を に加え、面積の上界 を求めよ。
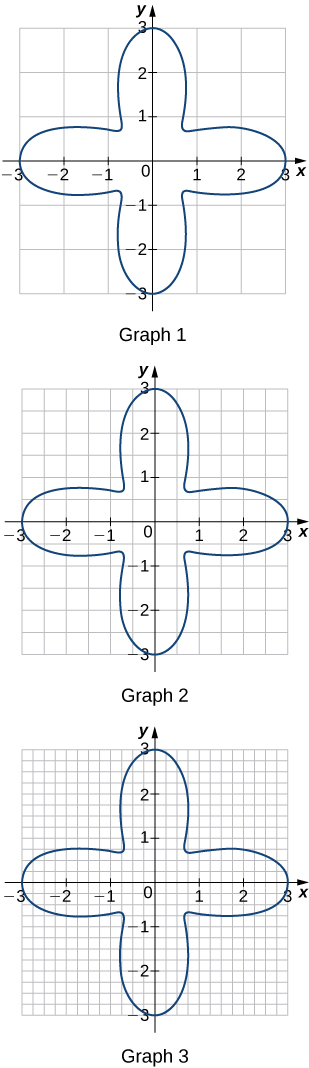
OpenStax, Rice University; Calculus Volume 1. · CC BY-NC-SA 4.0
Solution解き方
Graph 1: a. b. Graph 2: a. b. Graph 3: a. b.
図1:a. b. 図2:a. b. 図3:a. b.
Exercise 58問題 58
In the previous exercise, explain why gets no smaller while gets no larger as the squares are subdivided into four boxes of equal area.
英語のヒント
前問で、各正方形を等しい面積の四つの正方形に細分すると、 が小さくならず、 が大きくならない理由を説明せよ。
Exercise 59問題 59
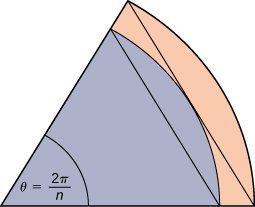
A unit circle is made up of n wedges equivalent to the inner wedge in the figure. The base of the inner triangle is 1 unit and its height is The base of the outer triangle is and the height is Use this information to argue that the area of a unit circle is equal to π.
単位円は、図の内側の扇形と同じ n 個の扇形でできている。内側の三角形の底辺は1、高さは である。外側の三角形の底辺は 、高さは である。この情報を使って、単位円の面積が π に等しいことを論じよ。
OpenStax, Rice University; Calculus Volume 1. · CC BY-NC-SA 4.0
Solution解き方
Let A be the area of the unit circle. The circle encloses n congruent triangles each of area so Similarly, the circle is contained inside n congruent triangles each of area so As so we conclude Also, as so we also have By the squeeze theorem for limits, we conclude that
単位円の面積を A とする。円の内側には、面積がそれぞれ の合同な三角形が n 個入るので、 となる。同様に、円は面積がそれぞれ の合同な三角形 n 個の内側に含まれるので、 となる。 であるから、 が得られる。また、 なので、 でもある。極限のはさみうちの定理より、 と結論できる。
left-endpoint approximation
左端近似
an approximation of the area under a curve computed by using the left endpoint of each subinterval to calculate the height of the vertical sides of each rectangle
各小区間の左端での関数値を長方形の高さとして用い、曲線の下の面積を近似する方法。
lower sum
下和
a sum obtained by using the minimum value of on each subinterval
各小区間での の最小値を用いて作る和。
partition
分割
a set of points that divides an interval into subintervals
区間を小区間に分ける点の集合。
regular partition
等分割
a partition in which the subintervals all have the same width
すべての小区間の幅が等しい分割。
riemann sum
リーマン和
an estimate of the area under the curve of the form
という形で表される、曲線の下の面積の見積もり。
right-endpoint approximation
右端近似
the right-endpoint approximation is an approximation of the area of the rectangles under a curve using the right endpoint of each subinterval to construct the vertical sides of each rectangle
各小区間の右端での関数値を長方形の高さとして用い、曲線の下の面積を近似する方法。
sigma notation
シグマ記法
(also, summation notation) the Greek letter sigma (Σ) indicates addition of the values; the values of the index above and below the sigma indicate where to begin the summation and where to end it
和の記法ともいう。ギリシャ文字シグマ(Σ)で値の加算を表す。Σの下側と上側に書かれた添字の値は、どの項からどの項まで足すかを示す。
upper sum
上和
a sum obtained by using the maximum value of on each subinterval
各小区間での の最大値を用いて作る和。