第11章カイ二乗分布
11.6 Test of a Single Variance11.6 一つの分散の検定
A test of a single variance assumes that the underlying distribution is normal. The null and alternative hypotheses are stated in terms of the population variance (or population standard deviation). The test statistic is:
英語のヒント
一つの分散の検定では、もとの分布が正規分布であることを仮定する。帰無仮説と対立仮説は、母分散(または母標準偏差)について述べる。検定統計量は次のとおりである。
where:
ここで、各記号は次を表す。
- n = the total number of datan = データの総数
- s2 = sample variances2 = 標本分散
- σ2 = population varianceσ2 = 母分散
You may think of s as the random variable in this test. The number of degrees of freedom is df = n - 1. A test of a single variance may be right-tailed, left-tailed, or two-tailed. Example 11.10 will show you how to set up the null and alternative hypotheses. The null and alternative hypotheses contain statements about the population variance.
この検定では、sを確率変数と考えればよい。自由度はdf = n − 1である。一つの分散の検定は、右片側、左片側、両側のいずれにもなりうる。例11.10で帰無仮説と対立仮説の立て方を示す。帰無仮説と対立仮説は、母分散についての記述を含む。
Example 11.10例題 11.10
Math instructors are not only interested in how their students do on exams, on average, but how the exam scores vary. To many instructors, the variance (or standard deviation) may be more important than the average.
英語のヒント
数学の教員は、学生の試験成績の平均だけでなく、得点がどのようにばらつくかにも関心を持っている。多くの教員にとって、分散(または標準偏差)は平均より重要かもしれない。
Suppose a math instructor believes that the standard deviation for his final exam is five points. One of his best students thinks otherwise. The student claims that the standard deviation is more than five points. If the student were to conduct a hypothesis test, what would the null and alternative hypotheses be?
英語のヒント
数学の教員が、期末試験の標準偏差は5点だと考えているとする。最も優秀な学生の1人は、そうではないと考え、標準偏差は5点より大きいと主張する。この学生が仮説検定を行うとしたら、帰無仮説と対立仮説はどうなるか。
Solution解き方
Even though we are given the population standard deviation, we can set up the test using the population variance as follows.
与えられているのは母標準偏差だが、母分散を使って次のように検定を設定できる。
- H0: σ2 = 52H0:σ2 = 52
- Ha: σ2 > 52Ha:σ2 > 52
Example 11.11例題 11.11
With individual lines at its various windows, a post office finds that the standard deviation for normally distributed waiting times for customers on Friday afternoon is 7.2 minutes. The post office experiments with a single, main waiting line and finds that for a random sample of 25 customers, the waiting times for customers have a standard deviation of 3.5 minutes.
ある郵便局では窓口ごとに列があり、金曜の午後の客の待ち時間は正規分布に従い、標準偏差は7.2分であることが分かった。郵便局は共通の1本の待ち列を試したところ、無作為に抽出した25人の客の待ち時間の標準偏差は3.5分だった。
With a significance level of 5%, test the claim that a single line causes lower variation among waiting times (shorter waiting times) for customers.
有意水準5%で、1本の待ち列にすると客の待ち時間のばらつきが小さくなる(待ち時間が短くなる)という主張を検定しよう。
Solution解き方
Since the claim is that a single line causes less variation, this is a test of a single variance. The parameter is the population variance, σ2, or the population standard deviation, σ.
1本の列にするとばらつきが小さくなるという主張なので、これは一つの分散の検定である。母数は母分散σ2、または母標準偏差σである。
Random Variable: The sample standard deviation, s, is the random variable. Let s = standard deviation for the waiting times.
確率変数:標本標準偏差sが確率変数である。sを待ち時間の標準偏差とする。
- H0: σ2 = 7.22H0:σ2 = 7.22
- Ha: σ2 < 7.22Ha:σ2 < 7.22
The word "less" tells you this is a left-tailed test.
「小さい」という語から、左片側検定だと分かる。
Distribution for the test: , where:
検定に用いる分布:。ここで、
- n = the number of customers sampledn = 標本として選んだ客の人数
- df = n – 1 = 25 – 1 = 24
Calculate the test statistic:
検定統計量を計算する。
where n = 25, s = 3.5, and σ = 7.2.
ここで、n = 25、s = 3.5、σ = 7.2である。
Graph:
グラフ:
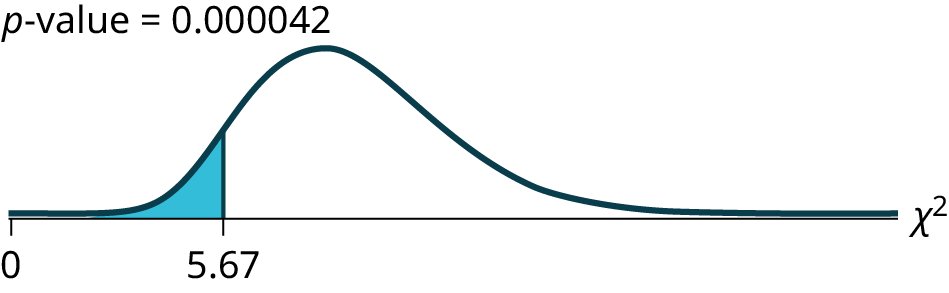

Figure 11.11図 11.11
Probability statement: p-value = P ( χ2 < 5.67) = 0.000042
確率の式:p値 = P ( χ2 < 5.67) = 0.000042
Compare α and the p-value:
αとp値を比較する。
- α = 0.05
- p-value = 0.000042p値 = 0.000042
- α > p-valueα > p値
Make a decision: Since α > p-value, reject H0. This means that you reject σ2 = 7.22. In other words, you do not think the variation in waiting times is 7.2 minutes; you think the variation in waiting times is less.
判断:α > p値なので、H0を棄却する。これはσ2 = 7.22を棄却することを意味する。言い換えると、待ち時間のばらつきを7.2分とは考えず、それより小さいと考える。
Conclusion: At a 5% level of significance, from the data, there is sufficient evidence to conclude that a single line causes a lower variation among the waiting times or with a single line, the customer waiting times vary less than 7.2 minutes.
結論:有意水準5%では、このデータから、1本の待ち列にすると待ち時間のばらつきが小さくなる、すなわち1本の列では客の待ち時間のばらつきが7.2分より小さくなると結論する十分な証拠が得られる。