第11章カイ二乗分布
11.3 Test of Independence11.3 独立性検定
Tests of independence involve using a contingency table of observed (data) values.
英語のヒント
独立性検定では、観測値(データ)の分割表を用いる。
The test statistic for a test of independence is similar to that of a goodness-of-fit test:
英語のヒント
独立性検定の検定統計量は、適合度検定の検定統計量に似ている。
where:
ここで、各記号は次を表す。
- O = observed valuesO = 観測値
- E = expected valuesE = 期待値
- i = the number of rows in the tablei = 表の行数
- j = the number of columns in the tablej = 表の列数
There are terms of the form .
という形の項が個ある。
A test of independence determines whether two factors are independent or not. You first encountered the term independence in Probability Topics. As a review, consider the following example.
独立性検定では、二つの要因が独立かどうかを判断する。「確率の話題」で初めて独立という用語を学んだ。復習として、次の例を考えよう。
Example 11.5例題 11.5
Suppose A = a speeding violation in the last year and B = a cell phone user while driving. If A and B are independent then P(A AND B) = P(A)P(B). A AND B is the event that a driver received a speeding violation last year and also used a cell phone while driving. Suppose, in a study of drivers who received speeding violations in the last year, and who used cell phone while driving, that 755 people were surveyed. Out of the 755, 70 had a speeding violation and 685 did not; 305 used cell phones while driving and 450 did not.
英語のヒント
Aを昨年のスピード違反、Bを運転中の携帯電話使用とする。AとBが独立なら、P(A AND B) = P(A)P(B)である。A AND Bは、運転者が昨年スピード違反をし、さらに運転中に携帯電話を使ったという事象である。昨年のスピード違反と運転中の携帯電話使用について、755人の運転者を調査したとする。755人中、スピード違反をした人は70人、しなかった人は685人だった。運転中に携帯電話を使った人は305人、使わなかった人は450人だった。
Let y = expected number of drivers who used a cell phone while driving and received speeding violations.
yを、運転中に携帯電話を使い、かつスピード違反をした運転者の人数の期待値とする。
If A and B are independent, then P(A AND B) = P(A)P(B). By substitution,
AとBが独立なら、P(A AND B) = P(A)P(B)である。代入すると、
Solve for y: y =
yについて解く:y =
About 28 people from the sample are expected to use cell phones while driving and to receive speeding violations.
標本のうち約28人が、運転中に携帯電話を使い、かつスピード違反をすると期待される。
In a test of independence, we state the null and alternative hypotheses in words. Since the contingency table consists of two factors, the null hypothesis states that the factors are independent and the alternative hypothesis states that they are not independent (dependent). If we do a test of independence using the example, then the null hypothesis is:
独立性検定では、帰無仮説と対立仮説を文章で述べる。分割表は二つの要因から構成されるため、帰無仮説はそれらの要因が独立であるとし、対立仮説は独立でない(従属する)とする。この例で独立性検定を行うなら、帰無仮説は次のようになる。
H0: Being a cell phone user while driving and receiving a speeding violation are independent events.
H0:運転中に携帯電話を使うことと、スピード違反をすることは、独立な事象である。
If the null hypothesis were true, we would expect about 28 people to use cell phones while driving and to receive a speeding violation.
英語のヒント
帰無仮説が正しければ、約28人が運転中に携帯電話を使い、かつスピード違反をすると期待される。
The test of independence is always right-tailed because of the calculation of the test statistic. If the expected and observed values are not close together, then the test statistic is very large and way out in the right tail of the chi-square curve, as it is in a goodness-of-fit.
検定統計量の計算方法により、独立性検定は常に右片側検定となる。期待値と観測値が互いに近くないと、適合度検定の場合と同じく、検定統計量は非常に大きくなり、カイ二乗曲線の右裾の遠い位置にくる。
The number of degrees of freedom for the test of independence is:
独立性検定の自由度は次のとおりである。
df = (number of columns - 1)(number of rows - 1)
df =(列数 − 1)(行数 − 1)
The following formula calculates the expected number (E):
期待値(E)は次の式で計算する。
Example 11.6例題 11.6
In a volunteer group, adults 21 and older volunteer from one to nine hours each week to spend time with a disabled senior citizen. The program recruits among community college students, four-year college students, and nonstudents. In Table 11.29 is a sample of the adult volunteers and the number of hours they volunteer per week.
英語のヒント
あるボランティア団体では、21歳以上の成人が週1~9時間、障害のある高齢者と過ごす活動を行っている。この事業では、コミュニティカレッジの学生、4年制大学の学生、学生でない人を募集している。表11.29は、成人のボランティアの標本と、その週あたりの活動時間を示す。
Type of Volunteer ボランティアの種類 |
1–3 Hours 1~3時間 |
4–6 Hours 4~6時間 |
7–9 Hours 7~9時間 |
Row Total 行合計 |
|---|---|---|---|---|
Community College Students コミュニティカレッジの学生 |
111 |
96 |
48 |
255 |
Four-Year College Students 4年制大学の学生 |
96 |
133 |
61 |
290 |
Nonstudents 学生ではない人 |
91 |
150 |
53 |
294 |
Column Total 列合計 |
298 |
379 |
162 |
839 |
Is the number of hours volunteered independent of the type of volunteer?
ボランティア活動の時間数は、ボランティアの種類と独立か。
Solution解き方
The observed table and the question at the end of the problem, "Is the number of hours volunteered independent of the type of volunteer?" tell you this is a test of independence. The two factors are number of hours volunteered and type of volunteer. This test is always right-tailed.
観測値の表と、問題の最後の「ボランティア活動の時間数は、ボランティアの種類と独立か」という問いから、これは独立性検定だと分かる。二つの要因は、活動時間数とボランティアの種類である。この検定は常に右片側検定である。
H0: The number of hours volunteered is independent of the type of volunteer.
H0:ボランティア活動の時間数は、ボランティアの種類と独立である。
Ha: The number of hours volunteered is dependent on the type of volunteer.
Ha:ボランティア活動の時間数は、ボランティアの種類に依存する。
The expected results are in Table 11.30.
期待される結果を表11.30に示す。
Type of Volunteer ボランティアの種類 |
1-3 Hours 1~3時間 |
4-6 Hours 4~6時間 |
7-9 Hours 7~9時間 |
|---|---|---|---|
Community College Students コミュニティカレッジの学生 |
90.57 |
115.19 |
49.24 |
Four-Year College Students 4年制大学の学生 |
103.00 |
131.00 |
56.00 |
Nonstudents 学生ではない人 |
104.42 |
132.81 |
56.77 |
For example, the calculation for the expected frequency for the top left cell is
例えば、左上のセルの期待度数は、次のように計算する。
Calculate the test statistic: χ2 = 12.99 (calculator or computer)
検定統計量を計算する:χ2 = 12.99(電卓またはコンピューターを使用)。
Distribution for the test:
検定に用いる分布:
df = (3 columns – 1)(3 rows – 1) = (2)(2) = 4
df =(3列 − 1)(3行 − 1)= (2)(2) = 4
Graph:
グラフ:
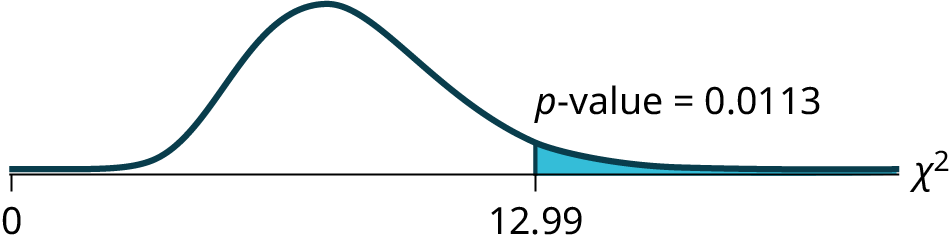

Figure 11.9図 11.9
Probability statement: p-value=P(χ2 > 12.99) = 0.0113
確率の式:p値 = P(χ2 > 12.99) = 0.0113
Compare α and the p-value: Since no α is given, assume α = 0.05. p-value = 0.0113. α > p-value.
αとp値を比較する。αが与えられていないので、α = 0.05とする。p値 = 0.0113であり、α > p値となる。
Make a decision: Since α > p-value, reject H0. This means that the factors are not independent.
判断:α > p値なので、H0を棄却する。これは、二つの要因が独立ではないことを意味する。
Conclusion: At a 5% level of significance, from the data, there is sufficient evidence to conclude that the number of hours volunteered and the type of volunteer are dependent on one another.
結論:有意水準5%では、このデータから、ボランティア活動の時間数とボランティアの種類が互いに依存すると結論する十分な証拠が得られる。
For the example in Table 11.29, if there had been another type of volunteer, teenagers, what would the degrees of freedom be?
英語のヒント
表11.29の例で、ボランティアの種類に10代の人がもう1種類加わっていたら、自由度はいくつになるか。
Using the Calculator電卓の操作
Example 11.7例題 11.7
De Anza College is interested in the relationship between anxiety level and the need to succeed in school. A random sample of 400 students took a test that measured anxiety level and need to succeed in school. Table 11.32 shows the results. De Anza College wants to know if anxiety level and need to succeed in school are independent events.
英語のヒント
デ・アンザ・カレッジは、不安の程度と学校で成功したいという欲求の関係に関心を持っている。無作為に抽出された400人の学生が、不安の程度と学校での成功欲求を測る検査を受けた。結果を表11.32に示す。この大学は、不安の程度と学校での成功欲求が独立な事象かどうかを知りたい。
Need to Succeed in School 学校での成功欲求 |
High Anxiety 不安が強い |
Med-high Anxiety 不安がやや強い |
Medium Anxiety 不安が中程度 |
Med-low Anxiety 不安がやや弱い |
Low Anxiety 不安が弱い |
Row Total 行合計 |
|---|---|---|---|---|---|---|
High Need 欲求が強い |
35 |
42 |
53 |
15 |
10 |
155 |
Medium Need 欲求が中程度 |
18 |
48 |
63 |
33 |
31 |
193 |
Low Need 欲求が弱い |
4 |
5 |
11 |
15 |
17 |
52 |
Column Total 列合計 |
57 |
95 |
127 |
63 |
58 |
400 |
a. How many high anxiety level students are expected to have a high need to succeed in school?
a. 不安が強い学生のうち、学校での成功欲求も強いと期待される人数は何人か。
Solution解き方
a. The column total for a high anxiety level is 57. The row total for high need to succeed in school is 155. The sample size or total surveyed is 400.
a. 不安が強い学生の列合計は57人である。学校での成功欲求が強い学生の行合計は155人である。標本の大きさ、すなわち調査した総人数は400人である。
The expected number of students who have a high anxiety level and a high need to succeed in school is about 22.
不安が強く、かつ学校での成功欲求も強い学生の人数の期待値は、約22人である。
b. If the two variables are independent, how many students do you expect to have a low need to succeed in school and a med-low level of anxiety?
b. 二つの変数が独立なら、学校での成功欲求が弱く、不安がやや弱い学生は何人いると期待されるか。
Solution解き方
b. The column total for a med-low anxiety level is 63. The row total for a low need to succeed in school is 52. The sample size or total surveyed is 400.
b. 不安がやや弱い学生の列合計は63人である。学校での成功欲求が弱い学生の行合計は52人である。標本の大きさ、すなわち調査した総人数は400人である。
The expected number of students who have a low need to succeed in school and a med-low level of anxiety is 8.
学校での成功欲求が弱く、不安がやや弱い学生の人数の期待値は8人である。