第11章カイ二乗分布
11.2 Goodness-of-Fit Test11.2 適合度検定
In this type of hypothesis test, you determine whether the data "fit" a particular distribution or not. For example, you may suspect your unknown data fit a binomial distribution. You use a chi-square test (meaning the distribution for the hypothesis test is chi-square) to determine if there is a fit or not. The null and the alternative hypotheses for this test may be written in sentences or may be stated as equations or inequalities.
英語のヒント
この種類の仮説検定では、データが特定の分布に「適合」するかどうかを調べる。例えば、分布が不明なデータが二項分布に適合するのではないかと考えることがある。適合するかどうかは、カイ二乗検定(仮説検定に用いる分布がカイ二乗分布であるという意味)で判断する。この検定の帰無仮説と対立仮説は、文章で書いても、等式や不等式で表してもよい。
The test statistic for a goodness-of-fit test is:
適合度検定の検定統計量は次のとおりである。
where:
ここで、各記号は次を表す。
- O = observed values (data)O = 観測値(データ)
- E = expected values (from theory)E = 期待値(理論から求める)
- k = the number of different data cells or categoriesk = 異なるデータのセルまたはカテゴリーの数
The observed values are the data values and the expected values are the values you would expect to get if the null hypothesis were true. There are n terms of the form .
英語のヒント
観測値とは実際のデータの値であり、期待値とは帰無仮説が正しいなら得られると予想される値である。という形の項がn個ある。
The number of degrees of freedom is df = (number of categories – 1).
自由度はdf =(カテゴリーの数 − 1)である。
The goodness-of-fit test is almost always right-tailed. If the observed values and the corresponding expected values are not close to each other, then the test statistic can get very large and will be way out in the right tail of the chi-square curve.
英語のヒント
適合度検定は、ほとんどの場合、右片側検定である。観測値とそれに対応する期待値が互いに近くなければ、検定統計量は非常に大きくなり、カイ二乗曲線の右裾の遠い位置にくる。
Example 11.1例題 11.1
Absenteeism of college students from math classes is a major concern to math instructors because missing class appears to increase the drop rate. Suppose that a study was done to determine if the actual student absenteeism rate follows faculty perception. The faculty expected that a group of 100 students would miss class according to Table 11.1.
英語のヒント
大学生が数学の授業を欠席することは、数学の教員にとって大きな懸念である。欠席すると履修を取りやめる割合が高まるとみられるからだ。学生の実際の欠席状況が教員の認識に一致するかを調べる研究を行ったとする。教員は、100人の学生が表11.1のように欠席すると予想した。
Number of absences per term 1学期あたりの欠席回数 |
Expected number of students 予想される学生数 |
|---|---|
0–2 |
50 |
3–5 |
30 |
6–8 |
12 |
9–11 |
6 |
12+ |
2 |
A random survey across all mathematics courses was then done to determine the actual number (observed) of absences in a course. The chart in Table 11.2 displays the results of that survey.
次に、全数学科目を対象とした無作為調査で、1科目での実際の欠席回数(観測値)を調べた。表11.2は、その調査結果を示している。
Number of absences per term 1学期あたりの欠席回数 |
Actual number of students 実際の学生数 |
|---|---|
0–2 |
35 |
3–5 |
40 |
6–8 |
20 |
9–11 |
1 |
12+ |
4 |
Determine the null and alternative hypotheses needed to conduct a goodness-of-fit test.
適合度検定の実施に必要な帰無仮説と対立仮説を定めよう。
H0: Student absenteeism fits faculty perception.
H0:学生の欠席状況は教員の認識に適合する。
The alternative hypothesis is the opposite of the null hypothesis.
対立仮説は帰無仮説の反対である。
Ha: Student absenteeism does not fit faculty perception.
Ha:学生の欠席状況は教員の認識に適合しない。
a. Can you use the information as it appears in the charts to conduct the goodness-of-fit test?
a. 表に示された情報をそのまま使って、適合度検定を実施できるか。
Solution解き方
a. No. Notice that the expected number of absences for the "12+" entry is less than five (it is two). Combine that group with the "9–11" group to create new tables where the number of students for each entry are at least five. The new results are in Table 11.3 and Table 11.4.
英語のヒント
Number of absences per term 1学期あたりの欠席回数 |
Expected number of students 予想される学生数 |
|---|---|
0–2 |
50 |
3–5 |
30 |
6–8 |
12 |
9+ |
8 |
Number of absences per term 1学期あたりの欠席回数 |
Actual number of students 実際の学生数 |
|---|---|
0–2 |
35 |
3–5 |
40 |
6–8 |
20 |
9+ |
5 |
b. What is the number of degrees of freedom (df)?
b. 自由度(df)はいくつか。
Solution解き方
b. There are four "cells" or categories in each of the new tables.
b. 新しい表には、それぞれ四つの「セル」、すなわちカテゴリーがある。
df = number of cells – 1 = 4 – 1 = 3
df = セルの数 − 1 = 4 − 1 = 3
Example 11.2例題 11.2
Employers want to know which days of the week employees are absent in a five-day work week. Most employers would like to believe that employees are absent equally during the week. Suppose a random sample of 60 managers were asked on which day of the week they had the highest number of employee absences. The results were distributed as in Table 11.7. For the population of employees, do the days for the highest number of absences occur with equal frequencies during a five-day work week? Test at a 5% significance level.
英語のヒント
雇用主は、週5日勤務のうち、従業員がどの曜日に欠勤するかを知りたい。多くの雇用主は、各曜日に同じ程度の欠勤があると考えたいだろう。無作為に抽出した60人の管理者に、従業員の欠勤が最も多かったのは何曜日かを尋ねたとする。結果は表11.7のように分布した。従業員の母集団について、欠勤が最も多い曜日は、週5日の間に同じ度数で出現するだろうか。有意水準5%で検定しよう。
Monday 月曜日 |
Tuesday 火曜日 |
Wednesday 水曜日 |
Thursday 木曜日 |
Friday 金曜日 |
|
|---|---|---|---|---|---|
Number of Absences 欠勤数 |
15 |
12 |
9 |
9 |
15 |
Solution解き方
The null and alternative hypotheses are:
帰無仮説と対立仮説は次のとおりである。
- H0: The absent days occur with equal frequencies, that is, they fit a uniform distribution.H0:欠勤日は同じ度数で出現する。すなわち、一様分布に適合する。
- Ha: The absent days occur with unequal frequencies, that is, they do not fit a uniform distribution.Ha:欠勤日は異なる度数で出現する。すなわち、一様分布に適合しない。
If the absent days occur with equal frequencies, then, out of 60 absent days (the total in the sample: 15 + 12 + 9 + 9 + 15 = 60), there would be 12 absences on Monday, 12 on Tuesday, 12 on Wednesday, 12 on Thursday, and 12 on Friday. These numbers are the expected (E) values. The values in the table are the observed (O) values or data.
欠勤日が同じ度数で出現するなら、60件の欠勤日(標本の合計:15 + 12 + 9 + 9 + 15 = 60)のうち、月曜日が12件、火曜日が12件、水曜日が12件、木曜日が12件、金曜日が12件となるはずである。これらの数が期待値(E)である。表の値は観測値(O)、すなわちデータである。
This time, calculate the χ2 test statistic by hand. Make a chart with the following headings and fill in the columns:
今回は、χ2検定統計量を手計算しよう。次の見出しを持つ表を作り、各列を埋めよう。
- Expected (E) values (12, 12, 12, 12, 12)期待値(E)(12, 12, 12, 12, 12)
- Observed (O) values (15, 12, 9, 9, 15)観測値(O)(15, 12, 9, 9, 15)
- (O – E)
- (O – E)2
Now add (sum) the last column. The sum is three. This is the χ2 test statistic.
最後の列を足し合わせよう。合計は3になる。これがχ2検定統計量である。
To find the p-value, calculate P(χ2 > 3). This test is right-tailed. (Use a computer or calculator to find the p-value. You should get p-value = 0.5578.)
p値を求めるには、P(χ2 > 3)を計算する。この検定は右片側検定である。(コンピューターか電卓を使ってp値を求めよう。p値 = 0.5578となるはずである。)
The dfs are the number of cells – 1 = 5 – 1 = 4
自由度は、セルの数 − 1 = 5 − 1 = 4である。
Using the Calculator電卓の操作
Next, complete a graph like the following one with the proper labeling and shading. (You should shade the right tail.)
次に、以下のようなグラフに適切なラベルと陰影を加え、完成させよう。(右裾に陰影を付ける。)
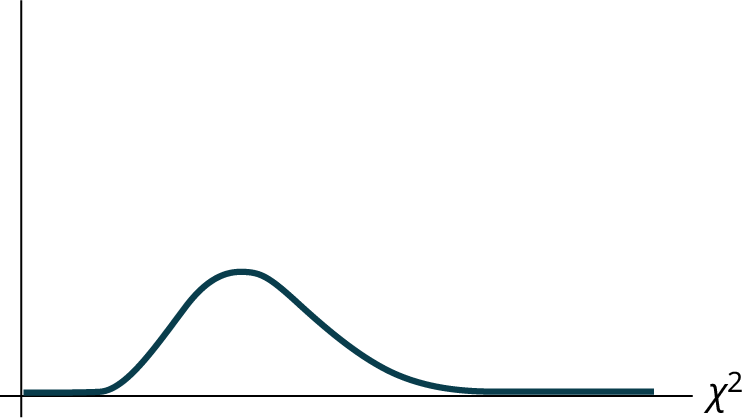
Figure 11.5図 11.5
The decision is not to reject the null hypothesis.
帰無仮説を棄却しないと判断する。
Conclusion: At a 5% level of significance, from the sample data, there is not sufficient evidence to conclude that the absent days do not occur with equal frequencies.
英語のヒント
結論:有意水準5%では、標本データから、欠勤日が同じ度数で出現しないと結論する十分な証拠は得られない。
Using the Calculator電卓の操作
Example 11.3例題 11.3
One study indicates that the number of streaming services that American families have is distributed (this is the given distribution for the American population) as in Table 11.9.
ある研究では、米国の家庭が利用している動画配信サービスの数は、表11.9のように分布しているという(これを米国の母集団について与えられた分布とする)。
Number of Streaming Services 動画配信サービスの数 |
Percent 百分率 |
|---|---|
0 |
10 |
1 |
16 |
2 |
55 |
3 |
11 |
4+ |
8 |
The table contains expected (E) percents.
この表には、予想される百分率(E)が示されている。
A random sample of 600 families in the far western United States resulted in the data in Table 11.10.
米国最西部の600世帯を無作為に抽出したところ、表11.10のデータが得られた。
Number of Streaming Services 動画配信サービスの数 |
Frequency 度数 |
|---|---|
0 |
66 |
1 |
119 |
2 |
340 |
3 |
60 |
4+ |
15 |
Total = 600 合計 = 600 |
The table contains observed (O) frequency values.
この表には、観測度数(O)が示されている。
At the 1% significance level, does it appear that the distribution "number of streaming services" of far western United States families is different from the distribution for the American population as a whole?
有意水準1%で、米国最西部の家庭の「動画配信サービスの数」の分布は、米国全体の母集団の分布と異なるといえるか。
Solution解き方
This problem asks you to test whether the far western United States families distribution fits the distribution of the American families. This test is always right-tailed.
この問題では、米国最西部の家庭の分布が、米国の家庭の分布に適合するかを検定する。この検定は常に右片側検定である。
The first table contains expected percentages. To get expected (E) frequencies, multiply the percentage by 600. The expected frequencies are shown in Table 11.11.
最初の表には、予想される百分率が示されている。期待度数(E)を得るには、その百分率に600を掛ける。期待度数を表11.11に示す。
Number of Streaming Services 動画配信サービスの数 |
Percent 百分率 |
Expected Frequency 期待度数 |
|---|---|---|
0 |
10 |
(0.10)(600) = 60 |
1 |
16 |
(0.16)(600) = 96 |
2 |
55 |
(0.55)(600) = 330 |
3 |
11 |
(0.11)(600) = 66 |
over 3 3より多い |
8 |
(0.08)(600) = 48 |
Therefore, the expected frequencies are 60, 96, 330, 66, and 48. In the TI calculators, you can let the calculator do the math. For example, instead of 60, enter 0.10*600.
したがって、期待度数は60、96、330、66、48となる。TI電卓では、その計算を電卓に任せられる。例えば、60の代わりに0.10*600と入力する。
H0: The "number of streaming services" distribution of far western United States families is the same as the "number of streaming services" distribution of the American population.
H0:米国最西部の家庭の「動画配信サービスの数」の分布は、米国の母集団の「動画配信サービスの数」の分布と同じである。
Ha: The "number of streaming services" distribution of far western United States families is different from the "number of streaming services" distribution of the American population.
Ha:米国最西部の家庭の「動画配信サービスの数」の分布は、米国の母集団の「動画配信サービスの数」の分布と異なる。
Distribution for the test: where df = (the number of cells) – 1 = 5 – 1 = 4.
検定に用いる分布:。ここでdf =(セルの数)− 1 = 5 − 1 = 4である。
Calculate the test statistic: χ2 = 29.65
検定統計量を計算する:χ2 = 29.65
Graph:
グラフ:
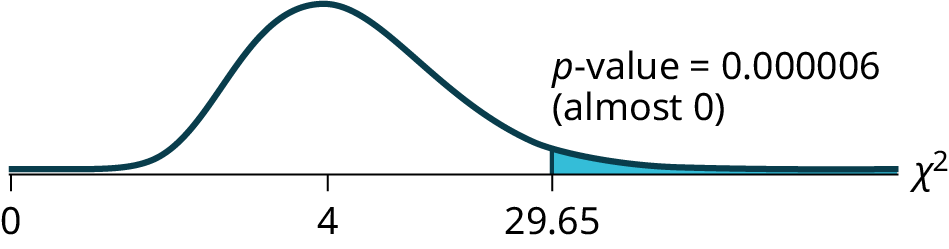
Figure 11.6図 11.6
Probability statement: p-value = P(χ2 > 29.65) = 0.000006
確率の式:p値 = P(χ2 > 29.65) = 0.000006
Compare α and the p-value:
αとp値を比較する。
- α = 0.01
- p-value = 0.000006p値 = 0.000006
So, α > p-value.
したがって、α > p値である。
Make a decision: Since α > p-value, reject Ho.
判断:α > p値なので、Hoを棄却する。
This means you reject the belief that the distribution for the far western states is the same as that of the American population as a whole.
英語のヒント
これは、最西部の州の分布が米国全体の母集団の分布と同じだという考えを棄却することを意味する。
Conclusion: At the 1% significance level, from the data, there is sufficient evidence to conclude that the "number of streaming services" distribution for the far western United States is different from the "number of streaming services" distribution for the American population as a whole.
結論:有意水準1%では、このデータから、米国最西部の「動画配信サービスの数」の分布が、米国全体の母集団の「動画配信サービスの数」の分布と異なると結論する十分な証拠が得られる。
Using the Calculator電卓の操作
Example 11.4例題 11.4
Suppose you flip two coins 100 times. The results are 20 HH, 27 HT, 30 TH, and 23 TT. Are the coins fair? Test at a 5% significance level.
英語のヒント
2枚の硬貨を100回投げたとする。結果はHHが20回、HTが27回、THが30回、TTが23回だった。硬貨に偏りはないだろうか。有意水準5%で検定しよう。
Solution解き方
This problem can be set up as a goodness-of-fit problem. The sample space for flipping two fair coins is {HH, HT, TH, TT}. Out of 100 flips, you would expect 25 HH, 25 HT, 25 TH, and 25 TT. This is the expected distribution. The question, "Are the coins fair?" is the same as saying, "Does the distribution of the coins (20 HH, 27 HT, 30 TH, 23 TT) fit the expected distribution?"
この問題は適合度の問題として設定できる。偏りのない2枚の硬貨を投げるときの標本空間は{HH, HT, TH, TT}である。100回投げれば、HHが25回、HTが25回、THが25回、TTが25回と予想される。これが期待される分布である。「硬貨に偏りはないか」という問いは、「硬貨の結果の分布(HHが20回、HTが27回、THが30回、TTが23回)は期待される分布に適合するか」と同じである。
Random Variable: Let X = the number of heads in one flip of the two coins. X takes on the values 0, 1, 2. (There are 0, 1, or 2 heads in the flip of two coins.) Therefore, the number of cells is three. Since X = the number of heads, the observed frequencies are 20 (for two heads), 57 (for one head), and 23 (for zero heads or both tails). The expected frequencies are 25 (for two heads), 50 (for one head), and 25 (for zero heads or both tails). This test is right-tailed.
確率変数:Xを、2枚の硬貨を1回投げたときに表が出る枚数とする。Xは0、1、2の値をとる。(2枚の硬貨を投げると、表の枚数は0、1、2のいずれかになる。)したがって、セルの数は3である。Xは表の枚数なので、観測度数は20(表が2枚)、57(表が1枚)、23(表が0枚、すなわち両方裏)である。期待度数は25(表が2枚)、50(表が1枚)、25(表が0枚、すなわち両方裏)である。この検定は右片側検定である。
H0: The coins are fair.
H0:硬貨に偏りはない。
Ha: The coins are not fair.
Ha:硬貨には偏りがある。
Distribution for the test: where df = 3 – 1 = 2.
検定に用いる分布:。ここでdf = 3 − 1 = 2である。
Calculate the test statistic: χ2 = 2.14
検定統計量を計算する:χ2 = 2.14
Graph:
グラフ:
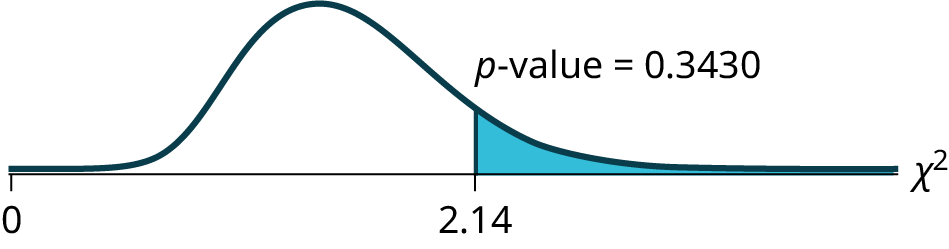


Figure 11.7図 11.7
Probability statement: p-value = P(χ2 > 2.14) = 0.3430
確率の式:p値 = P(χ2 > 2.14) = 0.3430
Compare α and the p-value:
αとp値を比較する。
- α = 0.05
- p-value = 0.3430p値 = 0.3430
α < p-value.
α < p値。
Make a decision: Since α < p-value, do not reject H0.
判断:α < p値なので、H0を棄却しない。
Conclusion: There is insufficient evidence to conclude that the coins are not fair.
結論:硬貨に偏りがあると結論する十分な証拠はない。