第11章カイ二乗分布
11.1 Facts About the Chi-Square Distribution11.1 カイ二乗分布の性質
The notation for the chi-square distribution is:
カイ二乗分布は次の記号で表す。
where df = degrees of freedom which depends on how chi-square is being used. (If you want to practice calculating chi-square probabilities then use df = n - 1. The degrees of freedom for the three major uses are each calculated differently.)
ここで、dfは自由度であり、その値はカイ二乗分布の使い方によって異なる。(カイ二乗確率の計算を練習する場合は、df = n - 1を用いる。三つの主な用途では、自由度をそれぞれ異なる方法で計算する。)
For the χ2 distribution, the population mean is μ = df and the population standard deviation is .
χ2分布では、母平均はμ = df、母標準偏差はである。
The random variable is shown as χ2, but may be any upper case letter.
英語のヒント
確率変数をχ2で表しているが、大文字ならどれを使ってもよい。
The random variable for a chi-square distribution with k degrees of freedom is the sum of k independent, squared standard normal variables.
英語のヒント
自由度kのカイ二乗分布の確率変数は、互いに独立なk個の標準正規変数をそれぞれ二乗したものの和である。
χ2 = (Z1)2 + (Z2)2 + ... + (Zk)2
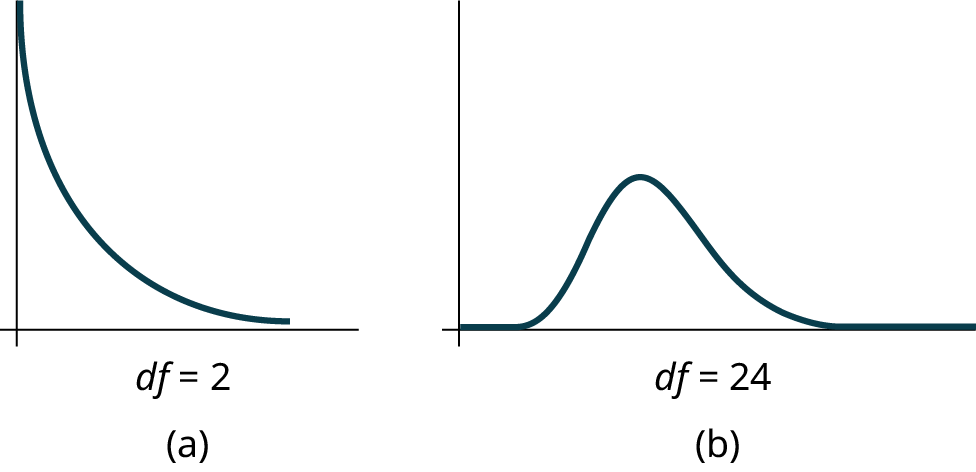
- The curve is nonsymmetrical and skewed to the right.
英語のヒント
曲線は左右対称ではなく、右に裾が長い。 - There is a different chi-square curve for each df.dfの値ごとに異なるカイ二乗曲線がある。Figure 11.2図 11.2
- The test statistic for any test is always greater than or equal to zero.どの検定でも、検定統計量は常に0以上である。
- When df > 90, the chi-square curve approximates the normal distribution. For X ~ the mean, μ = df = 1,000 and the standard deviation, σ = = 44.7. Therefore, X ~ N(1,000, 44.7), approximately.
英語のヒント
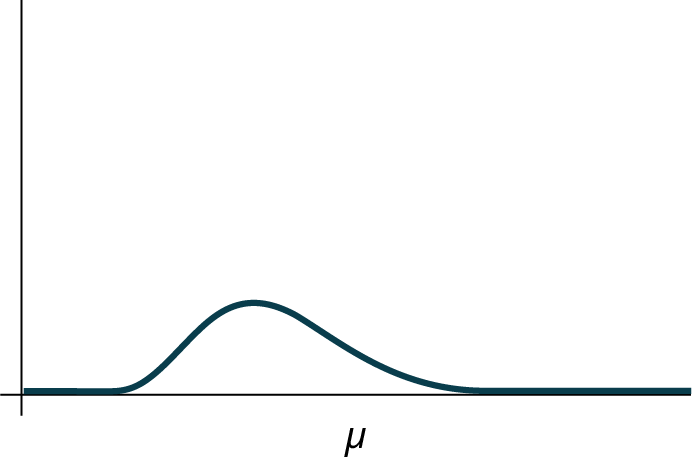
df > 90のとき、カイ二乗曲線は正規分布に近づく。X ~ では、平均はμ = df = 1,000、標準偏差はσ = = 44.7である。したがって、およそX ~ N(1,000, 44.7)となる。 - The mean, μ, is located just to the right of the peak.平均μは、曲線の頂点の少し右側に位置する。Figure 11.3図 11.3
References参考文献
Data from Parade Magazine.
データ出典:『Parade Magazine』。
“HIV/AIDS Epidemiology Santa Clara County.”Santa Clara County Public Health Department, May 2011.
「サンタクララ郡のHIV/AIDS疫学」。サンタクララ郡公衆衛生局、2011年5月。
Chapter Review章の復習
The chi-square distribution is a useful tool for assessment in a series of problem categories. These problem categories include primarily (i) whether a data set fits a particular distribution, (ii) whether the distributions of two populations are the same, (iii) whether two events might be independent, and (iv) whether there is a different variability than expected within a population.
英語のヒント
カイ二乗分布は、いくつかの種類の問題で判定に役立つ。主なものは、(i)データ集合が特定の分布に適合するか、(ii)二つの母集団の分布が同じか、(iii)二つの事象が独立でありうるか、(iv)母集団内のばらつきが予想と異なるか、という問題である。
An important parameter in a chi-square distribution is the degrees of freedom df in a given problem. The random variable in the chi-square distribution is the sum of squares of df standard normal variables, which must be independent. The key characteristics of the chi-square distribution also depend directly on the degrees of freedom.
カイ二乗分布の重要な母数は、与えられた問題における自由度dfである。カイ二乗分布の確率変数は、互いに独立なdf個の標準正規変数の二乗の和である。カイ二乗分布の主な性質も、自由度に直接依存する。
The chi-square distribution curve is skewed to the right, and its shape depends on the degrees of freedom df. For df > 90, the curve approximates the normal distribution. Test statistics based on the chi-square distribution are always greater than or equal to zero. Such application tests are almost always right-tailed tests.
カイ二乗分布の曲線は右に裾が長く、その形は自由度dfに依存する。df > 90では、曲線は正規分布に近づく。カイ二乗分布に基づく検定統計量は、常に0以上である。この分布を用いる検定は、ほとんどの場合、右片側検定である。
Formula Review公式の復習
χ2 = (Z1)2 + (Z2)2 + … (Zdf)2 chi-square distribution random variable
χ2 = (Z1)2 + (Z2)2 + … (Zdf)2:カイ二乗分布の確率変数
μχ2 = df chi-square distribution population mean
μχ2 = df:カイ二乗分布の母平均
Chi-Square distribution population standard deviation
:カイ二乗分布の母標準偏差
Exercises 1–5練習問題 1–5
Exercise 1問題 1
If the number of degrees of freedom for a chi-square distribution is 25, what is the population mean and standard deviation?
カイ二乗分布の自由度が25のとき、母平均と母標準偏差はいくつか。
Solution解き方
mean = 25 and standard deviation = 7.0711
平均 = 25、標準偏差 = 7.0711
Exercise 2問題 2
If df > 90, the distribution is _____________. If df = 15, the distribution is ________________.
df > 90のとき、分布は_____________である。df = 15のとき、分布は________________である。
Exercise 3問題 3
When does the chi-square curve approximate a normal distribution?
カイ二乗曲線は、どのようなとき正規分布に近づくか。
Solution解き方
when the number of degrees of freedom is greater than 90
自由度が90より大きいとき。
Exercise 4問題 4
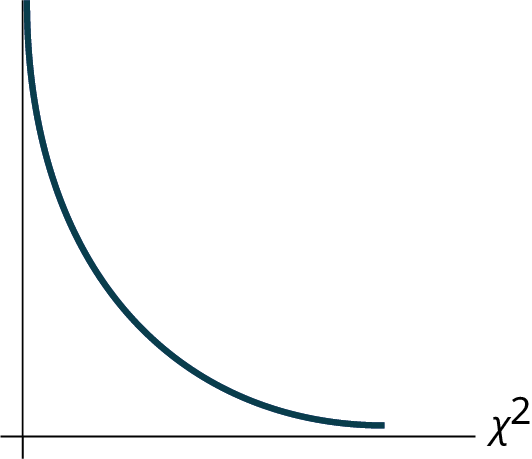
Where is μ located on a chi-square curve?
カイ二乗曲線では、μはどこに位置するか。


Homework宿題
Exercises 6–8練習問題 6–8
Decide whether the following statements are true or false.
次の記述が正しいか誤っているかを判断しよう。
Exercise 6問題 6
As the number of degrees of freedom increases, the graph of the chi-square distribution looks more and more symmetrical.
英語のヒント
自由度が増えるにつれて、カイ二乗分布のグラフはますます対称に近づく。
Solution解き方
true
正しい。
Exercise 7問題 7
The standard deviation of the chi-square distribution is twice the mean.
カイ二乗分布の標準偏差は、平均の2倍である。
Exercise 8問題 8
The mean and the median of the chi-square distribution are the same if df = 24.
df = 24のとき、カイ二乗分布の平均と中央値は等しい。
Solution解き方
false
誤り。