第10章2標本による仮説検定
References参考文献
Data from the United States Census Bureau. Available online at http://www.census.gov/prod/cen2010/briefs/c2010br-02.pdf
データ出典:米国国勢調査局。オンライン掲載先:http://www.census.gov/prod/cen2010/briefs/c2010br-02.pdf。
Hinduja, Sameer. “Sexting Research and Gender Differences.” Cyberbulling Research Center, 2013. Available online at http://cyberbullying.us/blog/sexting-research-and-gender-differences/ (accessed June 17, 2013).
サミール・ヒンドゥジャ。「セクスティングの研究と性差」。サイバーいじめ研究センター、2013年。オンライン掲載先:http://cyberbullying.us/blog/sexting-research-and-gender-differences/(2013年6月17日閲覧)。
“Smart Phone Users, By the Numbers.” Visually, 2013. Available online at http://visual.ly/smart-phone-users-numbers (accessed June 17, 2013).
「数字で見るスマートフォン利用者」。Visually、2013年。オンライン掲載先:http://visual.ly/smart-phone-users-numbers(2013年6月17日閲覧)。
Smith, Aaron. “35% of American adults own a Smartphone.” Pew Internet, 2013. Available online at http://www.pewinternet.org/~/media/Files/Reports/2011/PIP_Smartphones.pdf (accessed June 17, 2013).
アーロン・スミス。「米国成人の35%がスマートフォンを所有」。Pew Internet、2013年。オンライン掲載先:http://www.pewinternet.org/~/media/Files/Reports/2011/PIP_Smartphones.pdf(2013年6月17日閲覧)。
“State-Specific Prevalence of Obesity AmongAdults—Unites States, 2007.” MMWR, CDC. Available online at http://www.cdc.gov/mmwr/preview/mmwrhtml/mm5728a1.htm (accessed June 17, 2013).
「成人の州別肥満有病率――米国、2007年」。MMWR、CDC。オンライン掲載先:http://www.cdc.gov/mmwr/preview/mmwrhtml/mm5728a1.htm(2013年6月17日閲覧)。
“Texas Crime Rates 1960–1012.” FBI, Uniform Crime Reports, 2013. Available online at: http://www.disastercenter.com/crime/txcrime.htm (accessed June 17, 2013).
「テキサス州の犯罪率1960~1012年」。FBI、統一犯罪報告、2013年。オンライン掲載先:http://www.disastercenter.com/crime/txcrime.htm(2013年6月17日閲覧)。
Chapter Review章の復習
A hypothesis test of two population means from independent samples where the population standard deviations are known will have these characteristics:
母標準偏差が既知の場合に、独立標本に基づいて2つの母平均を検定するときは、次の特徴がある。
- Random variable: = the difference of the means確率変数: = 平均の差。
- Distribution: normal distribution分布:正規分布。
Formula Review公式の復習
Normal Distribution:
.
Generally µ1 – µ2 = 0.
.
Generally µ1 – µ2 = 0.
正規分布:。一般にµ1 – µ2 = 0。
Test Statistic (z-score):
Generally µ1 - µ2 = 0.
Generally µ1 - µ2 = 0.
検定統計量(z得点):。一般にµ1 − µ2 = 0。
where:
σ1 and σ2 are the known population standard deviations. n1 and n2 are the sample sizes. and are the sample means. μ1 and μ2 are the population means.
σ1 and σ2 are the known population standard deviations. n1 and n2 are the sample sizes. and are the sample means. μ1 and μ2 are the population means.
ここで、σ1とσ2は既知の母標準偏差、n1とn2は標本の大きさ、とは標本平均、μ1とμ2は母平均である。
Exercises 46–50練習問題 46–50
Use the following information to answer the next five exercises. The mean speeds of fastball pitches from two different baseball pitchers are to be compared. A sample of 14 fastball pitches is measured from each pitcher. The populations have normal distributions. Table 10.14 shows the result. Scouters believe that Rodriguez pitches a speedier fastball.
以下の情報を用いて次の5問に答えよ。2人の野球投手の速球の平均球速を比較する。各投手の速球14球を標本として測定する。母集団は正規分布に従う。表10.14に結果を示す。スカウトは、ロドリゲスの速球のほうが速いと考えている。
Pitcher 投手 |
Sample Mean Speed of Pitches (mph) 球速の標本平均(マイル毎時) |
Population Standard Deviation 母標準偏差 |
|---|---|---|
Wesley ウェズリー |
86 |
3 |
Rodriguez ロドリゲス |
91 |
7 |
Exercise 46問題 46
What is the random variable?
確率変数は何か。
Solution解き方
The difference in mean speeds of the fastball pitches of the two pitchers
2人の投手の速球の平均球速の差。
Exercise 47問題 47
State the null and alternative hypotheses.
帰無仮説と対立仮説を示す。
Exercise 48問題 48
What is the test statistic?
検定統計量はいくらか。
Solution解き方
–2.46
Exercise 49問題 49
What is the p-value?
p値はいくつか。
Exercise 50問題 50
At the 1% significance level, what is your conclusion?
有意水準1%では、どのような結論になるか。
Solution解き方
At the 1% significance level, we can reject the null hypothesis. There is sufficient data to conclude that the mean speed of Rodriguez’s fastball is faster than Wesley’s.
有意水準1%で帰無仮説を棄却できる。ロドリゲスの速球の平均球速はウェズリーより速いと結論づける十分なデータがある。
Exercises 51–55練習問題 51–55
Use the following information to answer the next five exercises. A researcher is testing the effects of plant food on plant growth. Nine plants have been given the plant food. Another nine plants have not been given the plant food. The heights of the plants are recorded after eight weeks. The populations have normal distributions. The following table is the result. The researcher thinks the food makes the plants grow taller.
以下の情報を用いて次の5問に答えよ。研究者が植物の成長に対する肥料の効果を検定する。9株には肥料を与え、別の9株には与えない。8週間後に草丈を記録する。母集団は正規分布に従う。次の表に結果を示す。研究者は、肥料によって植物の草丈が高くなると考えている。
Plant Group 植物の群 |
Sample Mean Height of Plants (inches) 草丈の標本平均(インチ) |
Population Standard Deviation 母標準偏差 |
|---|---|---|
Food 肥料あり |
16 |
2.5 |
No food 肥料なし |
14 |
1.5 |
Exercise 51問題 51
Is the population standard deviation known or unknown?
母標準偏差は既知か、未知か。
Exercise 52問題 52
State the null and alternative hypotheses.
帰無仮説と対立仮説を示す。
Solution解き方
Subscripts: 1 = Food, 2 = No Food
H0: μ1 ≤ μ2
Ha: μ1 > μ2
H0: μ1 ≤ μ2
Ha: μ1 > μ2
添字:1 = 肥料あり、2 = 肥料なし。H0:μ1 ≤ μ2。Ha:μ1 > μ2。
Exercise 53問題 53
What is the p-value?
p値はいくつか。
Exercise 54問題 54
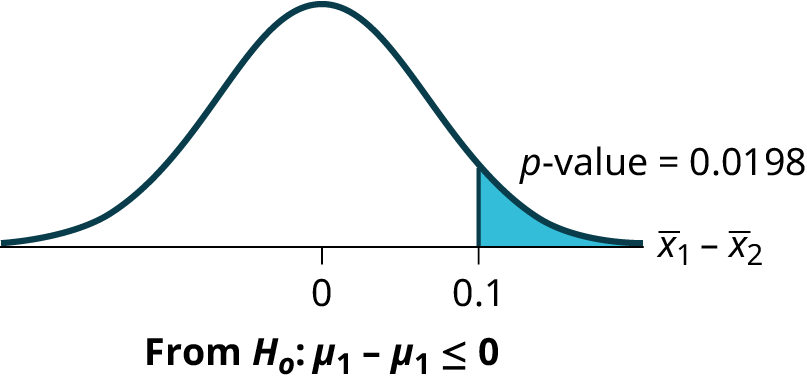
Draw the graph of the p-value.
p値を表すグラフを描く。

Exercise 55問題 55
At the 1% significance level, what is your conclusion?
有意水準1%では、どのような結論になるか。
Exercises 56–60練習問題 56–60
Use the following information to answer the next five exercises. Two metal alloys are being considered as material for ball bearings. The mean melting point of the two alloys is to be compared. 15 pieces of each metal are being tested. Both populations have normal distributions. The following table is the result. It is believed that Alloy Zeta has a different melting point.
英語のヒント
以下の情報を用いて次の5問に答えよ。玉軸受の材料として2種類の金属合金を検討している。両合金の平均融点を比較する。各金属15片を試験する。両母集団は正規分布に従う。次の表に結果を示す。合金ゼータは融点が異なると考えられている。
Sample Mean Melting Temperatures (°F) 融点の標本平均(°F) |
Population Standard Deviation 母標準偏差 |
|
|---|---|---|
Alloy Gamma 合金ガンマ |
800 |
95 |
Alloy Zeta 合金ゼータ |
900 |
105 |
Exercise 56問題 56
State the null and alternative hypotheses.
帰無仮説と対立仮説を示す。
Solution解き方
Subscripts: 1 = Gamma, 2 = Zeta
H0: μ1 = μ2
Ha: μ1 ≠ μ2
H0: μ1 = μ2
Ha: μ1 ≠ μ2
添字:1 = ガンマ、2 = ゼータ。H0:μ1 = μ2。Ha:μ1 ≠ μ2。
Exercise 57問題 57
Is this a right-, left-, or two-tailed test?
これは右片側、左片側、両側のどの検定か。
Exercise 58問題 58
What is the p-value?
p値はいくつか。
Solution解き方
0.0062
Exercise 59問題 59
Draw the graph of the p-value.
p値を表すグラフを描く。
Exercise 60問題 60
At the 1% significance level, what is your conclusion?
有意水準1%では、どのような結論になるか。
Solution解き方
There is sufficient evidence to reject the null hypothesis. The data support that the melting point for Alloy Zeta is different from the melting point of Alloy Gamma.
帰無仮説を棄却する十分な証拠がある。合金ゼータと合金ガンマでは融点が異なることを、データは支持している。
Homework宿題
Exercises 61–66練習問題 61–66
DIRECTIONS: For each of the word problems, use a solution sheet to do the hypothesis test. The solution sheet is found in Solution Sheets. Please feel free to make copies of the solution sheets. For the online version of the book, it is suggested that you copy the .doc or the .pdf files.
指示:各文章題について、解答用紙を使って仮説検定を行え。解答用紙は「解答用紙」にある。自由に複写してよい。本書のオンライン版では、.docファイルまたは.pdfファイルをコピーするとよい。
Exercise 61問題 61
A study is done to determine if students in the California state university system take longer to graduate, on average, than students enrolled in private universities. One hundred students from both the California state university system and private universities are surveyed. Suppose that from years of research, it is known that the population standard deviations are 1.5811 years and 1 year, respectively. The following data are collected. The California state university system students took on average 4.5 years with a standard deviation of 0.8. The private university students took on average 4.1 years with a standard deviation of 0.3.
カリフォルニア州立大学システムの学生は、私立大学の学生より卒業まで平均して長い時間がかかるかを調べる研究を行う。両方からそれぞれ100人を調査する。長年の研究から、母標準偏差はそれぞれ1.5811年と1年だとわかっているとする。州立大学システムの学生は平均4.5年、標準偏差0.8年、私立大学の学生は平均4.1年、標準偏差0.3年だった。
Exercise 62問題 62
Parents of teenage boys often complain that auto insurance costs more, on average, for teenage boys than for teenage girls. A group of concerned parents examines a random sample of insurance bills. The mean annual cost for 36 teenage boys was $679. For 23 teenage girls, it was $559. From past years, it is known that the population standard deviation for each group is $180. Determine whether or not you believe that the mean cost for auto insurance for teenage boys is greater than that for teenage girls.
10代の男子の親は、男子の自動車保険料は女子より平均して高いとよく不満を言う。関心を持った親たちが保険料請求書の無作為標本を調べた。男子36人の平均年間保険料は679ドル、女子23人では559ドルだった。過去の記録から、各集団の母標準偏差は180ドルだとわかっている。男子の平均自動車保険料は女子より高いと考えてよいか判断せよ。
Solution解き方
Subscripts: 1 = boys, 2 = girls
添字:1 = 男子、2 = 女子。
- H0: µ1 ≤ µ2
- Ha: µ1 > µ2
- The random variable is the difference in the mean auto insurance costs for boys and girls.確率変数は、男子と女子の平均自動車保険料の差である。
- normal正規分布
- test statistic: z = 2.50検定統計量:z = 2.50
- p-value: 0.0062p値:0.0062
- Answers may vary.解答はさまざまである。
- Alpha: 0.05α:0.05
- Decision: Reject the null hypothesis.判断:帰無仮説を棄却する。
- Reason for Decision: p-value < alpha判断の理由:p値 < α
- Conclusion: At the 5% significance level, there is sufficient evidence to conclude that the mean cost of auto insurance for teenage boys is greater than that for girls.結論:有意水準5%では、10代の男子の平均自動車保険料は女子より高いと結論づける十分な証拠がある。
Exercise 63問題 63
A group of transfer bound students wondered if they will spend the same mean amount on texts and supplies each year at their four-year university as they have at their community college. They conducted a random survey of 54 students at their community college and 66 students at their local four-year university. The sample means were $947 and $1,011, respectively. The population standard deviations are known to be $254 and $87, respectively. Conduct a hypothesis test to determine if the means are statistically the same.
英語のヒント
編入を予定している学生たちは、4年制大学で年間に使う教科書代と学用品代の平均が、コミュニティ・カレッジと同じかどうか疑問に思った。自分たちのコミュニティ・カレッジの学生54人と、地元の4年制大学の学生66人を無作為に調査した。標本平均はそれぞれ947ドルと1,011ドル、母標準偏差は254ドルと87ドルだとわかっている。平均が統計的に同じかどうかを調べる仮説検定を行え。
Exercise 64問題 64
Some manufacturers claim that non-hybrid sedan cars have a lower mean miles-per-gallon (mpg) than hybrid ones. Suppose that consumers test 21 hybrid sedans and get a mean of 31 mpg with a standard deviation of seven mpg. Thirty-one non-hybrid sedans get a mean of 22 mpg with a standard deviation of four mpg. Suppose that the population standard deviations are known to be six and three, respectively. Conduct a hypothesis test to evaluate the manufacturers claim.
あるメーカーは、非ハイブリッドのセダンはハイブリッド車より平均燃費(1ガロン当たりの走行マイル数、mpg)が低いと主張する。消費者がハイブリッドのセダン21台を試すと、平均31 mpg、標準偏差7 mpgだった。非ハイブリッドのセダン31台は平均22 mpg、標準偏差4 mpgだった。母標準偏差はそれぞれ6と3だとわかっているとする。メーカーの主張を評価する仮説検定を行え。
Solution解き方
Subscripts: 1 = non-hybrid sedans, 2 = hybrid sedans
添字:1 = 非ハイブリッドのセダン、2 = ハイブリッドのセダン。
- H0: µ1 ≥ µ2
- Ha: µ1 < µ2
- The random variable is the difference in the mean miles per gallon of non-hybrid sedans and hybrid sedans.確率変数は、非ハイブリッドとハイブリッドのセダンの平均燃費の差である。
- normal正規分布
- test statistic: 6.36検定統計量:6.36
- p-value: 0p値:0
- Answers may vary.解答はさまざまである。
- Alpha: 0.05α:0.05
- Decision: Reject the null hypothesis.判断:帰無仮説を棄却する。
- Reason for decision: p-value < alpha判断の理由:p値 < α
- Conclusion: At the 5% significance level, there is sufficient evidence to conclude that the mean miles per gallon of non-hybrid sedans is less than that of hybrid sedans.結論:有意水準5%では、非ハイブリッドのセダンの平均燃費はハイブリッド車より低いと結論づける十分な証拠がある。
Exercise 65問題 65
A baseball fan wanted to know if there is a difference between the number of games played in a World Series when the American League won the series versus when the National League won the series. From 1922 to 2012, the population standard deviation of games won by the American League was 1.14, and the population standard deviation of games won by the National League was 1.11. Of 19 randomly selected World Series games won by the American League, the mean number of games won was 5.76. The mean number of 17 randomly selected games won by the National League was 5.42. Conduct a hypothesis test.
ある野球ファンは、ワールドシリーズの試合数が、アメリカンリーグの優勝時とナショナルリーグの優勝時で異なるかを知りたかった。1922~2012年では、アメリカンリーグが勝った場合の試合数の母標準偏差は1.14、ナショナルリーグでは1.11だった。アメリカンリーグが勝ったワールドシリーズを無作為に19回選ぶと、平均試合数は5.76だった。ナショナルリーグが勝ったものを無作為に17回選ぶと、平均試合数は5.42だった。仮説検定を行え。
Exercise 66問題 66
One of the questions in a study of marital satisfaction of dual-career couples was to rate the statement “I’m pleased with the way we divide the responsibilities for childcare.” The ratings went from one (strongly agree) to five (strongly disagree). Table 10.17 contains ten of the paired responses for husbands and wives. Conduct a hypothesis test to see if the mean difference in the husband’s versus the wife’s satisfaction level is negative (meaning that, within the partnership, the husband is happier than the wife).
共働き夫婦の結婚満足度の研究で、「育児の責任の分担の仕方に満足している」という文への評価を尋ねた。評価は1(強く同意する)から5(まったく同意しない)までだった。表10.17に10組の夫婦の対応する回答を示す。夫と妻の満足度の平均差が負かどうか(その夫婦では夫のほうが妻より満足していることを意味する)を調べる仮説検定を行え。
Wife’s Score 妻の得点 |
2 |
2 |
3 |
3 |
4 |
2 |
1 |
1 |
2 |
4 |
Husband’s Score 夫の得点 |
2 |
2 |
1 |
3 |
2 |
1 |
1 |
1 |
2 |
4 |
Solution解き方
- H0: µd = 0
- Ha: µd < 0
- The random variable Xd is the average difference between husband’s and wife’s satisfaction level.確率変数Xdは、夫と妻の満足度の平均差である。
- t9
- test statistic: t = –1.86検定統計量:t = −1.86
- p-value: 0.0479p値:0.0479
- Answers may vary.解答はさまざまである。
- Alpha: 0.05α:0.05
- Decision: Reject the null hypothesis, but run another test.判断:帰無仮説を棄却するが、もう一度検定を行う。
- Reason for Decision: p-value < alpha判断の理由:p値 < α
- Conclusion: This is a weak test because alpha and the p-value are close. However, there is insufficient evidence to conclude that the mean difference is negative.結論:αとp値が近いため、この検定の根拠は弱い。ただし、平均差が負であると結論づける証拠は不十分である。