第10章2標本による仮説検定
10.3 Comparing Two Independent Population Proportions10.3 独立した2つの母比率の比較
When conducting a hypothesis test that compares two independent population proportions, the following characteristics should be present:
独立した2つの母比率を比較する仮説検定を行う際には、次の条件が必要である。
- The two independent samples are simple random samples that are independent.2つの独立標本は、互いに独立な単純無作為標本である。
- The number of successes is at least five, and the number of failures is at least five, for each of the samples.各標本で、成功数と失敗数がともに少なくとも5である。
- Growing literature states that the population must be at least ten or 20 times the size of the sample. This keeps each population from being over-sampled and causing incorrect results.
英語のヒント
母集団の大きさは標本の少なくとも10倍または20倍でなければならないとする文献が増えている。これにより、各母集団から抽出しすぎて結果が不正確になるのを防ぐ。
Comparing two proportions, like comparing two means, is common. If two estimated proportions are different, it may be due to a difference in the populations or it may be due to chance. A hypothesis test can help determine if a difference in the estimated proportions reflects a difference in the population proportions.
2つの割合の比較は、2つの平均の比較と同様、よく行われる。推定した2つの割合が異なる場合、母集団の違いによることも、偶然によることもある。仮説検定は、推定割合の差が母比率の差を反映しているかどうかの判断に役立つ。
Like the case of differences in sample means, we construct a sampling distribution for differences in sample proportions:
標本平均の差と同様に、標本比率の差の標本分布を構成する。
and are the sample proportions for the two sets of data in question and .
とは、対象とする2組のデータとの標本比率である。
The difference of two proportions follows an approximate normal distribution. Generally, the null hypothesis states that the two proportions are the same. That is, H0: pA = pB. To conduct the test, we use a pooled proportion, pc.
2つの割合の差は、近似的に正規分布に従う。一般に帰無仮説は、2つの割合が等しいとする。すなわちH0:pA = pBである。検定にはプールした比率pcを使う。
The pooled proportion is calculated as follows:プールした比率は次のように計算する。
The distribution for the differences is:差の分布は次のとおりである。
The test statistic (z-score) is:検定統計量(z得点):
Example 10.8例題 10.8
Two types of medication for hives are being tested to determine if there is a difference in the proportions of adult patient reactions. Twenty out of a random sample of 200 adults given medication A still had hives 30 minutes after taking the medication. Twelve out of another random sample of 200 adults given medication B still had hives 30 minutes after taking the medication. Test at a 1% level of significance.
英語のヒント
じんましんの2種類の薬について、成人患者の反応の割合に違いがあるかを調べる。薬Aを投与された成人200人の無作為標本では、20人に服薬30分後もじんましんが残っていた。薬Bを投与された別の成人200人の無作為標本では、12人に服薬30分後もじんましんが残っていた。有意水準1%で検定せよ。
Solution解き方
The problem asks for a difference in proportions, making it a test of two proportions.
問題は割合の違いを問うので、2つの割合の検定である。
Let A and B be the subscripts for medication A and medication B, respectively. Then pA and pB are the desired population proportions.
薬Aと薬Bの添字をそれぞれAとBとする。すると、pAとpBが求める母比率になる。
Random Variable: P′A – P′B = difference in the proportions of adult patients who did not react after 30 minutes to medication A and to medication B.
確率変数:P′A – P′B = 薬Aと薬Bに対して、30分後も反応しなかった成人患者の割合の差。
H0: pA = pB
pA – pB = 0
Ha: pA ≠ pB
pA – pB ≠ 0
The words "is a difference" tell you the test is two-tailed.
「違いがある」という言葉から、両側検定だとわかる。
Distribution for the test: Since this is a test of two binomial population proportions, the distribution is normal:
検定の分布:2つの二項母集団の割合の検定なので、正規分布になる。
P′A – P′B follows an approximate normal distribution.
P′A – P′Bは、近似的に正規分布に従う。
Calculate the p-value using the normal distribution: p-value = 0.1404.
正規分布でp値を計算する:p値 = 0.1404。
Estimated proportion for group A:
A群の推定割合:
Estimated proportion for group B:
B群の推定割合:
Graph:
グラフ:
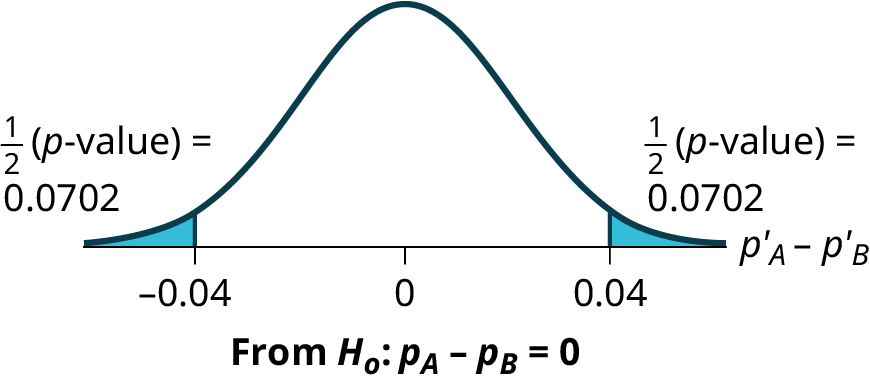
Figure 10.8図 10.8
P′A – P′B = 0.1 – 0.06 = 0.04.
Half the p-value is below –0.04, and half is above 0.04.
p値の半分が−0.04より下側、半分が0.04より上側にある。
Compare α and the p-value: α = 0.01 and the p-value = 0.1404. α < p-value.
αとp値を比較する。α = 0.01、p値 = 0.1404。α < p値。
Make a decision: Since α < p-value, do not reject H0.
判断する:α < p値なので、H0を棄却しない。
Conclusion: At a 1% level of significance, from the sample data, there is not sufficient evidence to conclude that there is a difference in the proportions of adult patients who did not react after 30 minutes to medication A and medication B.
結論:有意水準1%では、標本データから、30分後も反応しなかった成人患者の割合が薬Aと薬Bで異なると結論づける証拠は不十分である。
Using the Calculator電卓の操作
Example 10.9例題 10.9
A research study was conducted about gender differences regarding the use of seat belts in motor vehicles. The researcher believed that the proportion of women not wearing seat belts is less than the proportion of men not wearing seat belts. The data collected represents a random sample of U.S. adults and is summarized in Table 10.18. Is the proportion of women not wearing seat belts less than the proportion of men not wearing seat belts? Test at a 1% level of significance.
自動車のシートベルト着用に関する男女差を調べる研究を行った。研究者は、シートベルトを着用しない女性の割合は男性より低いと考えていた。集めたデータは米国成人の無作為標本であり、表10.18にまとめてある。着用しない女性の割合は男性より低いか。有意水準1%で検定せよ。
Men 男性 |
Women 女性 |
|
|---|---|---|
Does not wear seat belts シートベルトを着用しない |
183 |
156 |
Total number surveyed 調査人数の合計 |
2231 |
2169 |
Solution解き方
This is a test of two population proportions. Let M and F be the subscripts for men and women. Then pM and pF are the desired population proportions.
これは2つの母比率の検定である。男性と女性の添字をMとFとする。すると、pMとpFが求める母比率になる。
Random Variable: p′F − p′M = difference in the proportions of men and women who do not wear seat belts.
確率変数:p′F − p′M = シートベルトを着用しない男女の割合の差。
H0: pF = pM H0: pF – pM = 0
Ha: pF < pM Ha: pF – pM < 0
The words "less than" tell you the test is left-tailed.
「より低い」という言葉から、左片側検定だとわかる。
Distribution for the test: Since this is a test of two population proportions, the distribution is normal:
検定の分布:2つの母比率の検定なので、正規分布になる。
Therefore,
p′F – p′M follows an approximate normal distribution.
、。したがって。p′F – p′Mは近似的に正規分布に従う。
Calculate the p-value using the normal distribution:
p-value = 0.1045
Estimated proportion for women: 0.0719
Estimated proportion for men: 0.082
p-value = 0.1045
Estimated proportion for women: 0.0719
Estimated proportion for men: 0.082
正規分布でp値を計算する:p値 = 0.1045。女性の推定割合:0.0719。男性の推定割合:0.082。
Graph:
グラフ:
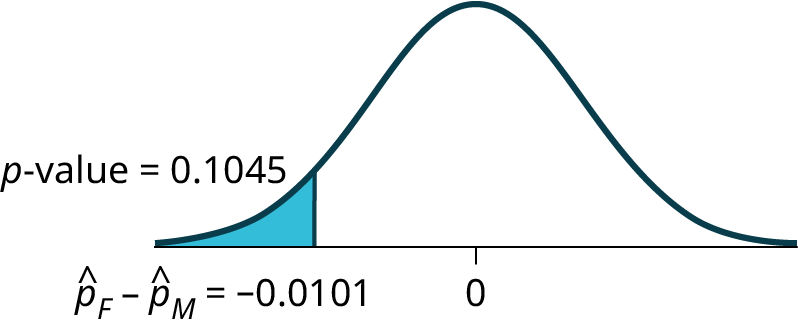
Figure 10.9図 10.9
Decision: Since α < p-value, Do not reject H0
判断:α < p値なので、H0を棄却しない。
Conclusion: At the 1% level of significance, from the sample data, there is not sufficient evidence to conclude that the proportion of women not wearing seat belts is less than the proportion of men not wearing seat belts.
結論:有意水準1%では、標本データから、シートベルトを着用しない女性の割合は男性より低いと結論づける証拠は不十分である。
Using the Calculator電卓の操作
Example 10.10例題 10.10
A marketing firm claims that the proportion of younger adults who own electric vehicles is greater than the proportion of older adults who own electric vehicles. A random sample of U.S. adults was taken, and the results of the survey indicate the following:
あるマーケティング会社は、若年成人が電気自動車を所有する割合は、年長の成人より高いと主張する。米国成人の無作為標本を取り、次の調査結果を得た。
- Out of a sample of 232 older adults (aged 35 or older), 5% own electric vehicles.年長の成人(35歳以上)232人の標本では、5%が電気自動車を所有する。
- Out of a sample of 1,343 young adults (aged 34 or younger), 10% own electric vehicles.若年成人(34歳以下)1,343人の標本では、10%が電気自動車を所有する。
Test at the 5% level of significance. Is the proportion of younger adults greater than the proportion of older adults with respect to owning electric vehicles?
有意水準5%で検定せよ。電気自動車を所有する割合は、若年成人のほうが年長の成人より高いか。
Solution解き方
This is a test of two population proportions. Let Y and O be the subscripts for younger adults and older adults, respectively. Then pY and pO are the desired population proportions.
これは2つの母比率の検定である。若年成人と年長の成人の添字をそれぞれYとOとする。すると、pYとpOが求める母比率になる。
Random Variable: p’Y and p’O = difference in the proportions of younger and older adults who own electric vehicles.
確率変数:p’Yとp’O = 電気自動車を所有する若年成人と年長の成人の割合の差。
The words "greater than" indicate that the test is right-tailed.
「より高い」という言葉は、右片側検定であることを示す。
Distribution for the test: The distribution is approximately normal:
検定の分布:近似的に正規分布になる。
Therefore,
したがって、
follows an approximate normal distribution.
は近似的に正規分布に従う。
Calculate the p-value using the normal distribution:
p-value = 0.0077
Estimated proportion for group Y: 0.10
Estimated proportion for group O: 0.05
p-value = 0.0077
Estimated proportion for group Y: 0.10
Estimated proportion for group O: 0.05
正規分布でp値を計算する:p値 = 0.0077。Y群の推定割合:0.10。O群の推定割合:0.05。
Graph:
グラフ:
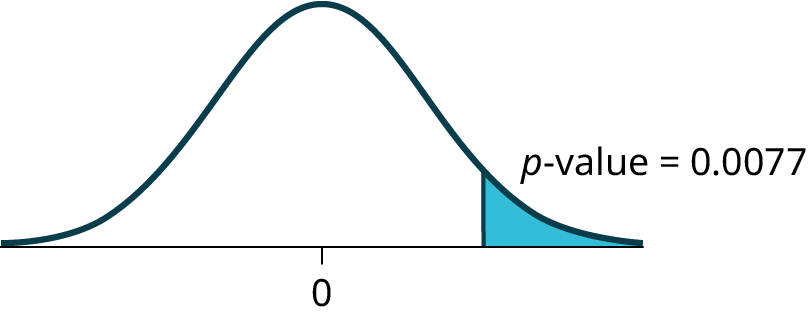


Figure 10.10図 10.10
Decision: Since > p-value, reject the .
判断:α > p値なので、を棄却する。
Conclusion: At the 5% level of significance, from the sample data, there is sufficient evidence to conclude that a larger proportion of younger adults own electric vehicles as compared to older adults.
結論:有意水準5%では、標本データから、電気自動車を所有する割合は若年成人のほうが年長の成人より高いと結論づける十分な証拠がある。