第10章2標本による仮説検定
Chapter Review章の復習
A hypothesis test for matched or paired samples (t-test) has these characteristics:
対応のある標本の仮説検定(t検定)には、次の特徴がある。
- Test the differences by subtracting one measurement from the other measurement一方の測定値から他方を引いた差を検定する。
- Random Variable: = mean of the differences確率変数: = 差の平均。
- Distribution: Student’s-t distribution with n – 1 degrees of freedom分布:自由度n − 1のスチューデントのt分布。
- If the number of differences is small (less than 30), the differences must follow a normal distribution.差の個数が少ない(30未満)場合、差は正規分布に従わなければならない。
- Two samples are drawn from the same set of objects.同じ対象の集合から2つの標本を得る。
- Samples are dependent.標本は互いに従属する。
Formula Review公式の復習
Test Statistic (t-score): t =
検定統計量(t得点):t =
where:
ここで、
is the mean of the sample differences. μd is the mean of the population differences. sd is the sample standard deviation of the differences. n is the sample size.
は標本の差の平均、μdは母集団の差の平均、sdは差の標本標準偏差、nは標本の大きさである。
Exercises 100–104練習問題 100–104
Use the following information to answer the next five exercises. A study was conducted to test the effectiveness of a software patch in reducing system failures over a six-month period. Results for randomly selected installations are shown in Table 10.30. The “before” value is matched to an “after” value, and the differences are calculated. The differences have a normal distribution. Test at the 1% significance level.
英語のヒント
以下の情報を用いて次の5問に答えよ。ソフトウェアの修正プログラムが6か月間のシステム障害を減らすのに有効かを調べる研究を行った。無作為に選んだ導入環境の結果を表10.30に示す。「前」の値と「後」の値を対応させて差を計算する。差は正規分布に従う。有意水準1%で検定せよ。
Installation 導入環境 |
A |
B |
C |
D |
E |
F |
G |
H |
|---|---|---|---|---|---|---|---|---|
Before 前 |
3 |
6 |
4 |
2 |
5 |
8 |
2 |
6 |
After 後 |
1 |
5 |
2 |
0 |
1 |
0 |
2 |
2 |
Exercise 100問題 100
What is the random variable?
確率変数は何か。
Solution解き方
the mean difference of the system failures
システム障害数の平均差。
Exercise 101問題 101
State the null and alternative hypotheses.
帰無仮説と対立仮説を示す。
Exercise 102問題 102
What is the p-value?
p値はいくつか。
Solution解き方
0.0067
Exercise 103問題 103
Draw the graph of the p-value.
p値を表すグラフを描く。
Exercise 104問題 104
What conclusion can you draw about the software patch?
修正プログラムについて、どのような結論を出せるか。
Solution解き方
With a p-value 0.0067, we can reject the null hypothesis. There is enough evidence to support that the software patch is effective in reducing the number of system failures.
p値は0.0067なので、帰無仮説を棄却できる。この修正プログラムはシステム障害数を減らすのに有効であるということを支持する十分な証拠がある。
Exercises 105–109練習問題 105–109
Use the following information to answer next five exercises. A study was conducted to test the effectiveness of a juggling class. Before the class started, six subjects juggled as many balls as they could at once. After the class, the same six subjects juggled as many balls as they could. The differences in the number of balls are calculated. The differences have a normal distribution. Test at the 1% significance level.
英語のヒント
以下の情報を用いて次の5問に答えよ。ジャグリング教室の効果を検定する研究を行った。受講前に6人が、できるだけ多くの球を同時に使ってジャグリングを行った。受講後も同じ6人が、できるだけ多くの球を使って行った。球数の差を計算する。差は正規分布に従う。有意水準1%で検定せよ。
Subject 被験者 |
A |
B |
C |
D |
E |
F |
|---|---|---|---|---|---|---|
Before 前 |
3 |
4 |
3 |
2 |
4 |
5 |
After 後 |
4 |
5 |
6 |
4 |
5 |
7 |
Exercise 105問題 105
State the null and alternative hypotheses.
帰無仮説と対立仮説を示す。
Exercise 106問題 106
What is the p-value?
p値はいくつか。
Solution解き方
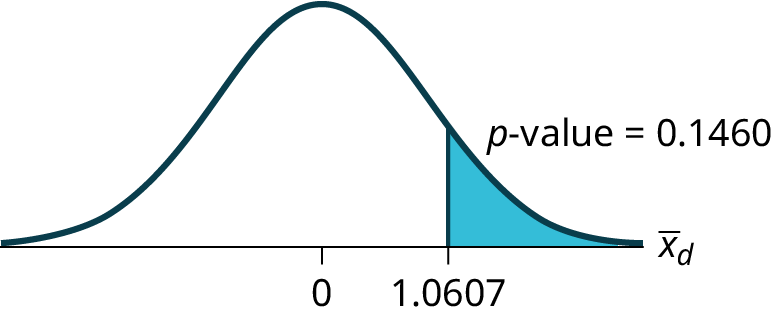
0.0021
Exercise 107問題 107
What is the sample mean difference?
差の標本平均はいくらか。
Exercise 108問題 108
Draw the graph of the p-value.
p値を表すグラフを描く。
Exercise 109問題 109
What conclusion can you draw about the juggling class?
ジャグリング教室について、どのような結論を出せるか。
Exercises 110–114練習問題 110–114
Use the following information to answer the next five exercises. A doctor wants to know if a blood pressure medication is effective. Six subjects have their blood pressures recorded. After twelve weeks on the medication, the same six subjects have their blood pressure recorded again. For this test, only systolic pressure is of concern. Test at the 1% significance level.
英語のヒント
以下の情報を用いて次の5問に答えよ。医師が降圧薬の有効性を知りたいと考えている。6人の血圧を記録した。12週間服薬した後、同じ6人の血圧を再び記録した。この検定では収縮期血圧だけに着目する。有意水準1%で検定せよ。
Patient 患者 |
A |
B |
C |
D |
E |
F |
|---|---|---|---|---|---|---|
Before 前 |
161 |
162 |
165 |
162 |
166 |
171 |
After 後 |
158 |
159 |
166 |
160 |
167 |
169 |
Exercise 110問題 110
State the null and alternative hypotheses.
帰無仮説と対立仮説を示す。
Solution解き方
H0: μd ≥ 0
Ha: μd < 0
Exercise 111問題 111
What is the test statistic?
検定統計量はいくらか。
Exercise 112問題 112
What is the p-value?
p値はいくつか。
Solution解き方
0.0699
Exercise 113問題 113
What is the sample mean difference?
差の標本平均はいくらか。
Exercise 114問題 114
What is the conclusion?
結論は何か。
Solution解き方
We decline to reject the null hypothesis. There is not sufficient evidence to support that the medication is effective.
帰無仮説を棄却しない。この薬が有効であることを支持する証拠は不十分である。
Homework宿題
Exercises 115練習問題 115
DIRECTIONS: For each of the word problems, use a solution sheet to do the hypothesis test. The solution sheet is found in Appendix E. Please feel free to make copies of the solution sheets. For the online version of the book, it is suggested that you copy the .doc or the .pdf files.
指示:各文章題について、解答用紙を使って仮説検定を行え。解答用紙は付録Eにある。自由に複写してよい。本書のオンライン版では、.docファイルまたは.pdfファイルをコピーするとよい。
Exercise 115問題 115
Ten individuals went on a low–fat diet for 12 weeks to lower their cholesterol. The data are recorded in Table 10.33. Do you think that their cholesterol levels were significantly lowered?
10人がコレステロールを下げるため、12週間低脂肪食を続けた。データを表10.33に示す。コレステロール値は有意に下がったと思うか。
Starting cholesterol level 開始時のコレステロール値 |
Ending cholesterol level 終了時のコレステロール値 |
|---|---|
140 |
140 |
220 |
230 |
110 |
120 |
240 |
220 |
200 |
190 |
180 |
150 |
190 |
200 |
360 |
300 |
280 |
300 |
260 |
240 |
Solution解き方
p-value = 0.1494
p値 = 0.1494
At the 5% significance level, there is insufficient evidence to conclude that the medication lowered cholesterol levels after 12 weeks.
有意水準5%では、この薬が12週間後のコレステロール値を下げたと結論づける証拠は不十分である。
Exercises 116–117練習問題 116–117
Use the following information to answer the next two exercises. A new heart disease prevention drug was tried on a group of 224 patients. Forty-five patients developed heart disease after four years. In a control group of 224 patients, 68 developed heart disease after four years. We want to test whether the method of treatment reduces the proportion of patients that develop heart disease after four years or if the proportions of the treated group and the untreated group stay the same.
以下の情報を用いて次の2問に答えよ。新しい心臓病予防薬を224人の患者に試した。4年後には45人が心臓病を発症した。対照群224人では、4年後に68人が発症した。この治療法が4年後に心臓病を発症する患者の割合を減らすのか、それとも治療群と非治療群の割合は同じままなのかを検定したい。
Let the subscript t = treated patient and ut = untreated patient.
添字tは治療した患者、utは治療していない患者を表す。
Exercise 116問題 116
The appropriate hypotheses are:
適切な仮説は次のどれか。
- H0: pt < put and Ha: pt ≥ putH0:pt < put、およびHa:pt ≥ put。
- H0: pt ≤ put and Ha: pt > putH0:pt ≤ put、およびHa:pt > put。
- H0: pt = put and Ha: pt ≠ putH0:pt = put、およびHa:pt ≠ put。
- H0: pt = put and Ha: pt < putH0:pt = put、およびHa:pt < put。
Exercise 117問題 117
If the p-value is 0.0062 what is the conclusion (use α = 0.05)?
p値が0.0062なら、結論は何か(α = 0.05を用いる)。
- The method has no effect.この方法には効果がない。
- There is sufficient evidence to conclude that the method reduces the proportion of patients who develop heart disease after four years.この方法は4年後に心臓病を発症する患者の割合を減らすと結論づける十分な証拠がある。
- There is sufficient evidence to conclude that the method increases the proportion of patients who develop heart disease after four years.この方法は4年後に心臓病を発症する患者の割合を増やすと結論づける十分な証拠がある。
- There is insufficient evidence to conclude that the method reduces the proportion of patients who develop heart disease after four years.この方法は4年後に心臓病を発症する患者の割合を減らすと結論づける証拠は不十分である。
Solution解き方
b
Exercises 118–123練習問題 118–123
Use the following information to answer the next two exercises. An experiment is conducted to show that blood pressure can be consciously reduced in people trained in a “biofeedback exercise program.” Six subjects were randomly selected and blood pressure measurements were recorded before and after the training. The difference between blood pressures was calculated (after - before) producing the following results: = −10.2 sd = 8.4. Using the data, test the hypothesis that the blood pressure has decreased after the training.
英語のヒント
以下の情報を用いて次の2問に答えよ。「バイオフィードバック運動プログラム」で訓練を受けた人は、意識的に血圧を下げられることを示す実験を行う。6人を無作為に選び、訓練前後の血圧を記録した。血圧の差(後 − 前)を計算すると、 = −10.2、sd = 8.4だった。このデータを用いて、訓練後に血圧が低下したという仮説を検定せよ。
Exercise 118問題 118
The distribution for the test is:
検定の分布は次のどれか。
- t5
- t6
- N(−10.2, 8.4)
- N(−10.2, )
Exercise 119問題 119
If α = 0.05, the p-value and the conclusion are
α = 0.05の場合、p値と結論は次のどれか。
- 0.0014; There is sufficient evidence to conclude that the blood pressure decreased after the training.0.0014。訓練後に血圧が低下したと結論づける十分な証拠がある。
- 0.0014; There is sufficient evidence to conclude that the blood pressure increased after the training.0.0014。訓練後に血圧が上昇したと結論づける十分な証拠がある。
- 0.0155; There is sufficient evidence to conclude that the blood pressure decreased after the training.0.0155。訓練後に血圧が低下したと結論づける十分な証拠がある。
- 0.0155; There is sufficient evidence to conclude that the blood pressure increased after the training.0.0155。訓練後に血圧が上昇したと結論づける十分な証拠がある。
Solution解き方
c
Exercise 120問題 120
A golf instructor is interested in determining if her new technique for improving players’ golf scores is effective. She takes four new students. She records their 18-hole scores before learning the technique and then after having taken her class. She conducts a hypothesis test. The data are as follows.
ゴルフ指導者は、プレーヤーのスコアを改善するための新しい手法が有効かどうかに関心がある。新しい受講生4人を取り、手法を学ぶ前と授業を受けた後の18ホールのスコアを記録し、仮説検定を行う。データは次のとおりである。
Player 1 選手1 |
Player 2 選手2 |
Player 3 選手3 |
Player 4 選手4 |
|
|---|---|---|---|---|
Mean score before class 受講前の平均スコア |
83 |
78 |
93 |
87 |
Mean score after class 受講後の平均スコア |
80 |
80 |
86 |
86 |
The correct decision is:
正しい判断は次のどれか。
- Reject H0.H0を棄却する。
- Do not reject the H0.H0を棄却しない。
Exercise 121問題 121
A local cancer support group believes that the estimate for new female breast cancer cases in the south is higher in Year 2 than in Year 1. The group compared the estimates of new female breast cancer cases by southern state in Year 1 and in Year 2. The results are in Table 10.35.
地元のがん支援団体は、南部の女性の新規乳がん症例の推定数が、1年目より2年目で多いと考えている。団体は南部各州について、1年目と2年目の女性の新規乳がん症例の推定数を比較した。結果を表10.35に示す。
Southern States 南部の州 |
Year 1 1年目 |
Year 2 2年目 |
|---|---|---|
Alabama アラバマ |
3,450 |
3,720 |
Arkansas アーカンソー |
2,150 |
2,280 |
Florida フロリダ |
15,540 |
15,710 |
Georgia ジョージア |
6,970 |
7,310 |
Kentucky ケンタッキー |
3,160 |
3,300 |
Louisiana ルイジアナ |
3,320 |
3,630 |
Mississippi ミシシッピ |
1,990 |
2,080 |
North Carolina ノースカロライナ |
7,090 |
7,430 |
Oklahoma オクラホマ |
2,630 |
2,690 |
South Carolina サウスカロライナ |
3,570 |
3,580 |
Tennessee テネシー |
4,680 |
5,070 |
Texas テキサス |
15,050 |
14,980 |
Virginia バージニア |
6,190 |
6,280 |
Solution解き方
Test: two matched pairs or paired samples (t-test)
検定:対応のある2標本(t検定)。
Random variable:
確率変数:
Distribution: t12
分布:t12
H0: μd = 0 Ha: μd > 0
The mean of the differences of new female breast cancer cases in the south between Year 2 and Year 1 is greater than zero. The estimate for new female breast cancer cases in the south is higher in Year 2 than in Year 1.
南部の女性の新規乳がん症例について、2年目と1年目の差の平均は0より大きい。南部の女性の新規乳がん症例の推定数は1年目より2年目のほうが多い。
Graph: right-tailed
グラフ:右片側。
p-value: 0.0004
p値:0.0004
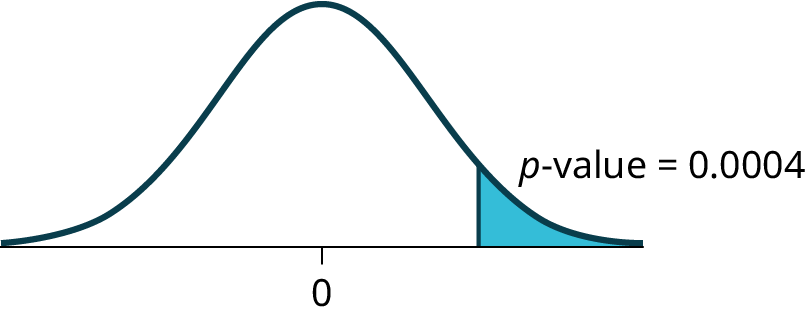
Figure 10.18図 10.18
Decision: Reject H0
判断:H0を棄却する。
Conclusion: At the 5% level of significance, from the sample data, there is sufficient evidence to conclude that there was a higher estimate of new female breast cancer cases in Year 2 than in Year 1.
結論:有意水準5%では、標本データから、女性の新規乳がん症例の推定数は1年目より2年目のほうが多かったと結論づける十分な証拠がある。
Exercise 122問題 122
A traveler wanted to know if the prices of hotels are different in the ten cities that he visits the most often. The list of the cities with the corresponding hotel prices for his two favorite hotel chains is in Table 10.36. Test at the 1% level of significance.
英語のヒント
ある旅行者は、最もよく訪れる10都市でホテルの料金に違いがあるかを知りたかった。お気に入りの2つのホテルチェーンについて、都市と対応する宿泊料金の一覧を表10.36に示す。有意水準1%で検定せよ。
Cities 都市 |
Hyatt Regency prices in dollars ハイアット・リージェンシーの料金(ドル) |
Hilton prices in dollars ヒルトンの料金(ドル) |
|---|---|---|
Atlanta アトランタ |
107 |
169 |
Boston ボストン |
358 |
289 |
Chicago シカゴ |
209 |
299 |
Dallas ダラス |
209 |
198 |
Denver デンバー |
167 |
169 |
Indianapolis インディアナポリス |
179 |
214 |
Los Angeles ロサンゼルス |
179 |
169 |
New York City ニューヨーク市 |
625 |
459 |
Philadelphia フィラデルフィア |
179 |
159 |
Washington, DC ワシントンD.C. |
245 |
239 |
Exercise 123問題 123
A politician asked their staff to determine whether the underemployment rate in the northeast decreased year over year. The results are in Table 10.37.
英語のヒント
ある政治家が職員に、北東部の不完全就業率が前年より低下したかどうかを調べるよう求めた。結果を表10.37に示す。
Northeastern States 北東部の州 |
Year 1 1年目 |
Year 2 2年目 |
|---|---|---|
Connecticut コネティカット |
17.3 |
16.4 |
Delaware デラウェア |
17.4 |
13.7 |
Maine メイン |
19.3 |
16.1 |
Maryland メリーランド |
16.0 |
15.5 |
Massachusetts マサチューセッツ |
17.6 |
18.2 |
New Hampshire ニューハンプシャー |
15.4 |
13.5 |
New Jersey ニュージャージー |
19.2 |
18.7 |
New York ニューヨーク |
18.5 |
18.7 |
Ohio オハイオ |
18.2 |
18.8 |
Pennsylvania ペンシルベニア |
16.5 |
16.9 |
Rhode Island ロードアイランド |
20.7 |
22.4 |
Vermont バーモント |
14.7 |
12.3 |
West Virginia ウェストバージニア |
15.5 |
17.3 |
Solution解き方
Test: matched or paired samples (t-test)
検定:対応のある標本(t検定)。
Difference data: {–0.9, –3.7, –3.2, –0.5, 0.6, –1.9, –0.5, 0.2, 0.6, 0.4, 1.7, –2.4, 1.8}
差のデータ:{−0.9, −3.7, −3.2, −0.5, 0.6, −1.9, −0.5, 0.2, 0.6, 0.4, 1.7, −2.4, 1.8}。
Random Variable:
確率変数:
Distribution: H0: μd = 0 Ha: μd < 0
分布:H0:μd = 0。Ha:μd < 0。
The mean of the differences of the rate of underemployment in the northeastern states between Year 2 and Year 1 is less than zero. The underemployment rate went down from Year 1 to Year 2.
北東部各州の不完全就業率について、2年目と1年目の差の平均は0未満である。不完全就業率は1年目から2年目に低下した。
Graph: left-tailed.
グラフ:左片側。
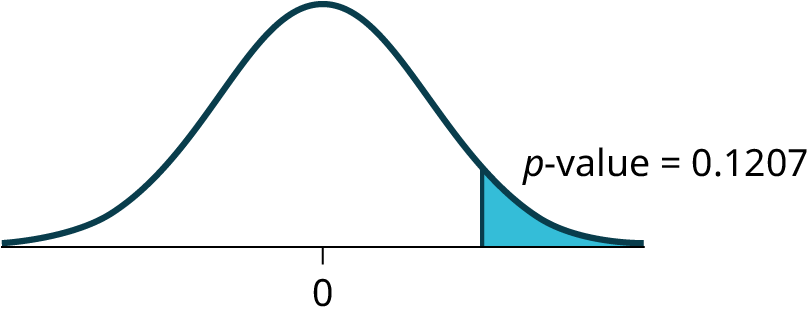


Figure 10.19図 10.19
p-value: 0.1207
p値:0.1207
Decision: Do not reject H0.
判断:H0を棄却しない。
Conclusion: At the 5% level of significance, from the sample data, there is not sufficient evidence to conclude that there was a decrease in the underemployment rates of the northeastern states from Year 1 to Year 2.
結論:有意水準5%では、標本データから、北東部各州の不完全就業率は1年目から2年目に低下したと結論づける証拠は不十分である。