第10章2標本による仮説検定
10.4 Matched or Paired Samples10.4 対応のある標本
When using a hypothesis test for matched or paired samples, the following characteristics should be present:
対応のある標本の仮説検定を用いる際には、次の条件が必要である。
- Simple random sampling is used.単純無作為抽出を用いる。
- Sample sizes are often small.標本の大きさは小さいことが多い。
- Two measurements (samples) are drawn from the same pair of individuals or objects.対応する同じ人や物から2つの測定値(標本)を得る。
- Differences are calculated from the matched or paired samples.対応のある標本から差を計算する。
- The differences form the sample that is used for the hypothesis test.その差が、仮説検定に用いる標本になる。
- Either the matched pairs have differences that come from a population that is normal or the number of differences is sufficiently large so that distribution of the sample mean of differences is approximately normal.
英語のヒント
対応する対の差が正規母集団から得られたものであるか、または差の個数が十分多く、差の標本平均の分布が近似的に正規分布になる。
In a hypothesis test for matched or paired samples, subjects are matched in pairs and differences are calculated. The differences are the data. The population mean for the differences, μd, is then tested using a Student's-t test for a single population mean with n – 1 degrees of freedom, where n is the number of differences.
対応のある標本の仮説検定では、対象を対にして差を計算する。この差がデータとなる。その差の母平均μdを、自由度n − 1の1母平均のスチューデントのt検定で検定する。ここでnは差の個数である。
The test statistic (t-score) is:検定統計量(t得点):
Example 10.11例題 10.11
A study was conducted to investigate the effectiveness of hypnotism in reducing pain. Results for randomly selected subjects are shown in Table 10.23. A lower score indicates less pain. The "before" value is matched to an "after" value and the differences are calculated. The differences have a normal distribution. Are the sensory measurements, on average, lower after hypnotism? Test at a 5% significance level.
英語のヒント
催眠が痛みを減らすのにどれほど有効かを調べる研究を行った。無作為に選んだ被験者の結果を表10.23に示す。得点が低いほど痛みが少ない。「前」の値を「後」の値と対応させ、差を計算する。差は正規分布に従う。感覚の測定値は、催眠後に平均して低くなるか。有意水準5%で検定せよ。
Subject: 被験者: |
A |
B |
C |
D |
E |
F |
G |
H |
|---|---|---|---|---|---|---|---|---|
Before 前 |
6.6 |
6.5 |
9.0 |
10.3 |
11.3 |
8.1 |
6.3 |
11.6 |
After 後 |
6.8 |
2.4 |
7.4 |
8.5 |
8.1 |
6.1 |
3.4 |
2.0 |
Solution解き方
Corresponding "before" and "after" values form matched pairs. (Calculate "after" – "before.")
対応する「前」と「後」の値が対を作る。(「後」−「前」を計算する。)
After Data 後のデータ |
Before Data 前のデータ |
Difference 差 |
|---|---|---|
6.8 |
6.6 |
0.2 |
2.4 |
6.5 |
-4.1 |
7.4 |
9 |
-1.6 |
8.5 |
10.3 |
-1.8 |
8.1 |
11.3 |
-3.2 |
6.1 |
8.1 |
-2 |
3.4 |
6.3 |
-2.9 |
2 |
11.6 |
-9.6 |
The data for the test are the differences: {0.2, –4.1, –1.6, –1.8, –3.2, –2, –2.9, –9.6}
検定のデータは差である:{0.2, −4.1, −1.6, −1.8, −3.2, −2, −2.9, −9.6}。
The sample mean and sample standard deviation of the differences are: and Verify these values.
差の標本平均と標本標準偏差はとである。これらの値を確かめよ。
Let be the population mean for the differences. We use the subscript to denote "differences."
差の母平均をとする。「差(differences)」を表すため、添字を用いる。
Random variable: = the mean difference of the sensory measurements
確率変数: = 感覚の測定値の平均差。
H0: μd ≥ 0
The null hypothesis is zero or positive, meaning that there is the same or more pain felt after hypnotism. That means the subject shows no improvement. μd is the population mean of the differences.)
帰無仮説では差は0または正であり、催眠後の痛みが同じか、より強いことを意味する。つまり、被験者に改善が見られないということだ。μdは差の母平均である。
Ha: μd < 0
The alternative hypothesis is negative, meaning there is less pain felt after hypnotism. That means the subject shows improvement. The score should be lower after hypnotism, so the difference ought to be negative to indicate improvement.
対立仮説では差は負であり、催眠後の痛みが弱いことを意味する。つまり、被験者に改善が見られるということだ。催眠後は得点が低くなるはずなので、改善を示す差は負になるはずである。
Distribution for the test: The distribution is a Student's t with df = n – 1 = 8 – 1 = 7. Use t7. (Notice that the test is for a single population mean.)
検定の分布:自由度df = n − 1 = 8 − 1 = 7のスチューデントのt分布。t7を使う。(1つの母平均の検定であることに注意する。)
Calculate the test statistic and p-value using the Student's t-distribution:
スチューデントのt分布で、検定統計量とp値を計算する。
test statistic, t = –3.036, p-value = 0.0095
検定統計量t = −3.036、p値 = 0.0095。
Graph:
グラフ:
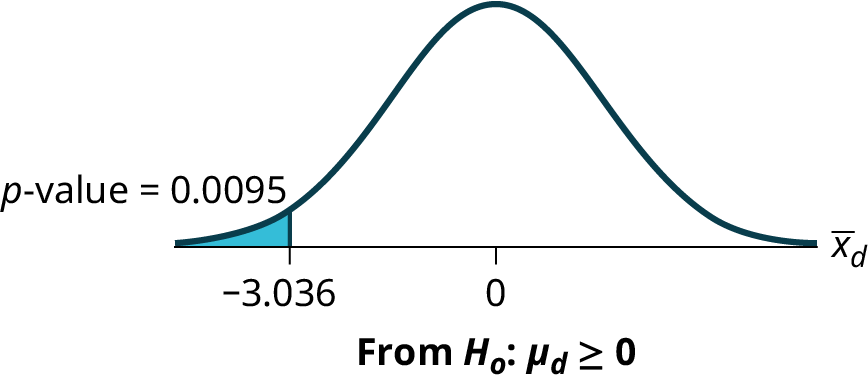
Figure 10.14図 10.14
is the random variable for the differences.
は、差についての確率変数である。
The sample mean and sample standard deviation of the differences are:
差の標本平均と標本標準偏差は次のとおりである。
= –3.13
= 2.91
Compare α and the p-value: α = 0.05 and p-value = 0.0095. α > p-value.
αとp値を比較する。α = 0.05、p値 = 0.0095。α > p値。
Make a decision: Since α > p-value, reject H0. This means that μd < 0 and there is improvement.
判断:α > p値なので、H0を棄却する。これはμd < 0で、改善があることを意味する。
Conclusion: At a 5% level of significance, from the sample data, there is sufficient evidence to conclude that the sensory measurements, on average, are lower after hypnotism. Hypnotism appears to be effective in reducing pain.
結論:有意水準5%では、標本データから、催眠後の感覚測定値は平均して低くなると結論づける十分な証拠がある。催眠は痛みを減らすのに有効であるようだ。
Using the Calculator電卓の操作
Example 10.12例題 10.12
A college softball coach was interested in whether the college's strength development class increased their players' maximum lift (in pounds). Four players participated in the study. The amount of weight they could each lift was recorded before they took the strength development class. After completing the class, the amount of weight they could each lift was again measured. The data are as follows:
大学のソフトボールのコーチは、大学の筋力向上クラスによって選手の最大挙上重量(ポンド)が増えるかどうかに関心を持った。4人の選手が研究に参加した。受講前に各選手が持ち上げられる重量を記録し、受講後に再び測定した。データは次のとおりである。
Weight (in pounds) 重量(ポンド) |
Player 1 選手1 |
Player 2 選手2 |
Player 3 選手3 |
Player 4 選手4 |
|---|---|---|---|---|
Amount of weight lifted prior to the class 受講前の挙上重量 |
205 |
241 |
338 |
368 |
Amount of weight lifted after the class 受講後の挙上重量 |
295 |
252 |
330 |
360 |
The coach wants to know if the strength development class makes the players stronger, on average.
Record the differences data. Calculate the differences by subtracting the amount of weight lifted prior to the class from the weight lifted after completing the class. The data for the differences are: {90, 11, -8, -8}. Assume the differences have a normal distribution.
Record the differences data. Calculate the differences by subtracting the amount of weight lifted prior to the class from the weight lifted after completing the class. The data for the differences are: {90, 11, -8, -8}. Assume the differences have a normal distribution.
コーチは、このクラスが選手の筋力を平均して高めるかどうかを知りたい。差のデータを記録せよ。受講後の挙上重量から受講前の挙上重量を引いて計算する。差のデータは{90, 11, −8, −8}である。差は正規分布に従うと仮定する。
Using the differences data, calculate the sample mean and the sample standard deviation.
差のデータから、標本平均と標本標準偏差を計算せよ。
Using the difference data, this becomes a test of a single __________ (fill in the blank).
差のデータを用いると、これは1つの__________の検定となる(空欄を埋めよ)。
Define the random variable: mean difference in the maximum lift per player.
確率変数を定義する:は、選手1人当たりの最大挙上重量の平均差。
The distribution for the hypothesis test is t3.
仮説検定の分布はt3である。
H0: μd ≤ 0, Ha: μd > 0
Graph:
グラフ:
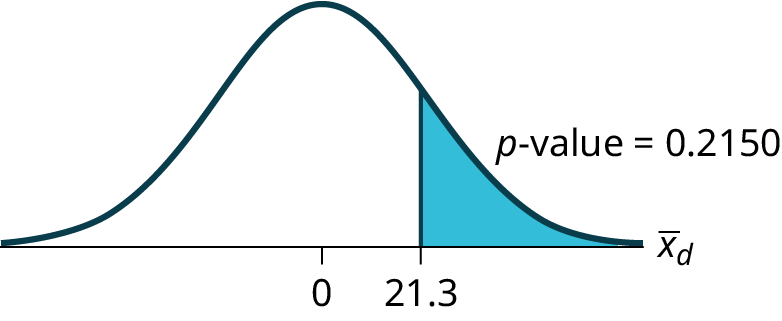
Figure 10.15図 10.15
Calculate the p-value: The p-value is 0.2150
p値を計算する:p値は0.2150。
Decision: If the level of significance is 5%, the decision is not to reject the null hypothesis, because α < p-value.
判断:有意水準が5%なら、α < p値なので帰無仮説を棄却しない。
What is the conclusion?
結論は何か。
At a 5% level of significance, from the sample data, there is not sufficient evidence to conclude that the strength development class helped to make the players stronger, on average. It should be noted that this data set consists of a very small sample size, with the possibility of an outlier data value. It is important to confirm that the matched pairs have differences that come from a population that is normal. The coach may want to consider increasing the sample size of players in the study.
有意水準5%では、標本データから、筋力向上クラスが選手の筋力を平均して高めるのに役立ったと結論づける証拠は不十分である。このデータは標本が非常に小さく、外れ値が含まれる可能性もあることに注意する。対応する対の差が正規母集団から得られたものであることを確かめるのが重要である。コーチは研究に参加する選手を増やすことを検討してもよい。
Example 10.13例題 10.13
Seven eighth graders at Kennedy Middle School measured how far they could push the shot-put with their dominant (writing) hand and their weaker (non-writing) hand. They thought that they could push equal distances with either hand. The data were collected and recorded in Table 10.28.
英語のヒント
ケネディ・ミドルスクールの8年生7人が、利き手(字を書く手)と反対の手(字を書かない手)で砲丸をどこまで押し出せるか測定した。どちらの手でも同じ距離を出せると考えていた。集めたデータを表10.28に示す。
Distance (in feet) using 次の手を使った距離(フィート) |
Student 1 学生1 |
Student 2 学生2 |
Student 3 学生3 |
Student 4 学生4 |
Student 5 学生5 |
Student 6 学生6 |
Student 7 学生7 |
|---|---|---|---|---|---|---|---|
Dominant Hand 利き手 |
30 |
26 |
34 |
17 |
19 |
26 |
20 |
Weaker Hand 反対の手 |
28 |
14 |
27 |
18 |
17 |
26 |
16 |
Conduct a hypothesis test to determine whether the mean difference in distances between the children’s dominant versus weaker hands is significant.
子どもたちの利き手と反対の手での距離の平均差が有意かどうか、仮説検定を行え。
Record the differences data. Calculate the differences by subtracting the distances with the weaker hand from the distances with the dominant hand. The data for the differences are: {2, 12, 7, –1, 2, 0, 4}. The differences have a normal distribution.
差のデータを記録せよ。利き手の距離から反対の手の距離を引いて計算する。差のデータは{2, 12, 7, −1, 2, 0, 4}である。差は正規分布に従う。
Using the differences data, calculate the sample mean and the sample standard deviation. = 3.71, = 4.5.
差のデータから標本平均と標本標準偏差を計算する。 = 3.71、 = 4.5。
Random variable: = mean difference in the distances between the hands.
確率変数: = 両手での距離の平均差。
Distribution for the hypothesis test: t6
仮説検定の分布:t6
H0: μd = 0 Ha: μd ≠ 0
Graph:
グラフ:
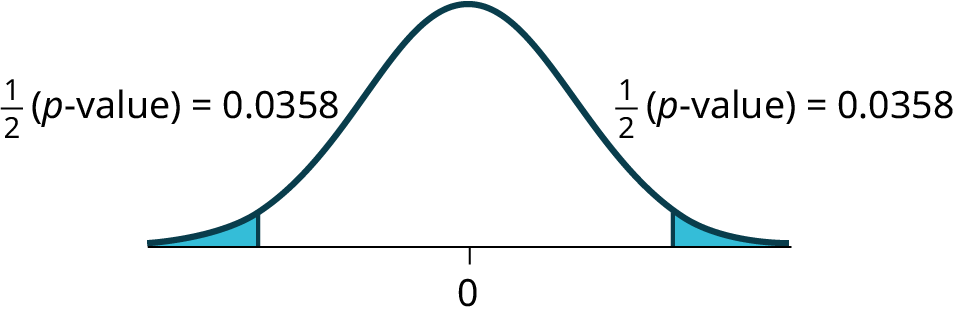


Figure 10.16図 10.16
Calculate the p-value: The p-value is 0.0716 (using the data directly).
p値を計算する:データを直接使うと、p値は0.0716。
(test statistic = 2.18. p-value = 0.0719 using
(検定統計量 = 2.18。を使うと、p値 = 0.0719。)
Decision: Assume α = 0.05. Since α < p-value, Do not reject H0.
判断:α = 0.05とする。α < p値なので、H0を棄却しない。
Conclusion: At the 5% level of significance, from the sample data, there is not sufficient evidence to conclude that there is a difference in the children’s weaker and dominant hands to push the shot-put.
結論:有意水準5%では、標本データから、子どもが砲丸を押し出す距離は利き手と反対の手で異なると結論づける証拠は不十分である。