第10章2標本による仮説検定
10.2 Two Population Means with Known Standard Deviations10.2 標準偏差が既知の2つの母平均
Even though this situation is not likely (knowing the population standard deviations is not likely), the following example illustrates hypothesis testing for independent means, known population standard deviations. The sampling distribution for the difference between the means is normal and both populations must be normal. The random variable is . The normal distribution has the following format:
英語のヒント
この状況はあまり起こらない(母標準偏差がわかっていることは少ない)が、次の例では、母標準偏差が既知の独立した平均の仮説検定を説明する。平均の差の標本分布は正規分布であり、両母集団も正規分布でなければならない。確率変数はである。正規分布は次の形になる。
Normal distribution is:正規分布:
The standard deviation is:標準偏差:
The test statistic (z-score) is:検定統計量(z得点):
Example 10.6例題 10.6
Independent groups, population standard deviations known: The mean lasting time of two competing floor waxes is to be compared. Twenty floors are randomly assigned to test each wax. Both populations have a normal distributions. The data are recorded in Table 10.12.
独立した集団、母標準偏差が既知:競合する2種類の床用ワックスの平均持続時間を比較する。各ワックスにつき20面の床を無作為に割り当てて試す。両母集団は正規分布に従う。データを表10.12に示す。
Wax ワックス |
Sample Mean Number of Months Floor Wax Lasts 床用ワックスが持続する月数の標本平均 |
Population Standard Deviation 母標準偏差 |
|---|---|---|
1 |
3 |
0.33 |
2 |
2.9 |
0.36 |
Does the data indicate that wax 1 is more effective than wax 2? Test at a 5% level of significance.
データはワックス1がワックス2より効果的であることを示しているか。有意水準5%で検定せよ。
Solution解き方
This is a test of two independent groups, two population means, population standard deviations known.
これは独立した2集団の2つの母平均の検定で、母標準偏差は既知である。
Random Variable: = difference in the mean number of months the competing floor waxes last.
確率変数: = 競合する床用ワックスが持続する平均月数の差。
H0: μ1 ≤ μ2
Ha: μ1 > μ2
The words "is more effective" says that wax 1 lasts longer than wax 2, on average. "Longer" is a “>” symbol and goes into Ha. Therefore, this is a right-tailed test.
「より効果的」は、ワックス1のほうがワックス2より平均して長持ちするという意味である。「より長い」は「>」で表し、Haに入る。したがって、これは右片側検定である。
Distribution for the test: The population standard deviations are known so the distribution is normal. Using the formula, the distribution is:
検定の分布:母標準偏差が既知なので、正規分布になる。公式を使うと、分布は次のとおりである。
Since μ1 ≤ μ2 then μ1 – μ2 ≤ 0 and the mean for the normal distribution is zero.
μ1 ≤ μ2なので、μ1 – μ2 ≤ 0であり、正規分布の平均は0である。
Calculate the p-value using the normal distribution: p-value = 0.1799
正規分布を用いてp値を計算する:p値 = 0.1799。
Graph:
グラフ:
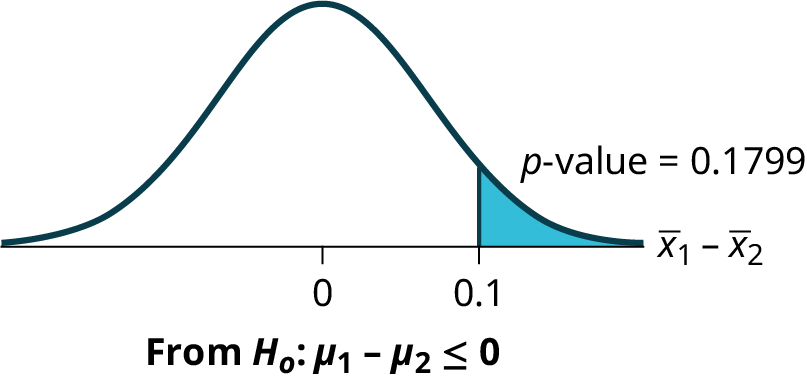
Figure 10.5図 10.5
– = 3 – 2.9 = 0.1
Compare α and the p-value: α = 0.05 and p-value = 0.1799. Therefore, α < p-value.
αとp値を比較する。α = 0.05、p値 = 0.1799。したがってα < p値。
Make a decision: Since α < p-value, do not reject H0.
判断する:α < p値なので、H0を棄却しない。
Conclusion: At the 5% level of significance, from the sample data, there is not sufficient evidence to conclude that the mean time wax 1 lasts is longer (wax 1 is more effective) than the mean time wax 2 lasts.
結論:有意水準5%では、標本データから、ワックス1の平均持続時間はワックス2より長い(ワックス1のほうが効果的)と結論づける証拠は不十分である。
Using the Calculator電卓の操作
Example 10.7例題 10.7
An interested citizen wanted to know if Democratic U. S. senators are older than Republican U.S. senators, on average. During a certain year, the mean age of 30 randomly selected Republican Senators was 61 years 247 days old (61.675 years) with a standard deviation of 10.17 years. The mean age of 30 randomly selected Democratic senators was 61 years 257 days old (61.704 years) with a standard deviation of 9.55 years.
ある市民は、民主党の米国上院議員は共和党の上院議員より平均年齢が高いかどうかに関心を持った。ある年、無作為に選んだ共和党議員30人の平均年齢は61歳247日(61.675歳)、標準偏差は10.17歳だった。無作為に選んだ民主党議員30人の平均年齢は61歳257日(61.704歳)、標準偏差は9.55歳だった。
Do the data indicate that Democratic senators are older than Republican senators, on average? Test at a 5% level of significance.
データは、民主党の上院議員の平均年齢が共和党より高いことを示すか。有意水準5%で検定せよ。
Solution解き方
This is a test of two independent groups, two population means. The population standard deviations are unknown, but the sum of the sample sizes is 30 + 30 = 60, which is greater than 30, so we can use the normal approximation to the Student’s-t distribution. Subscripts: 1: Democratic senators 2: Republican senators
これは独立した2集団の2つの母平均の検定である。母標準偏差は未知だが、標本の大きさの合計は30 + 30 = 60で30を超えるので、スチューデントのt分布を正規分布で近似できる。添字:1は民主党議員、2は共和党議員。
Random variable: = difference in the mean age of Democratic and Republican U.S. senators.
確率変数: = 民主党と共和党の米国上院議員の平均年齢の差。
H0: µ1 ≤ µ2 H0: µ1 – µ2 ≤ 0
Ha: µ1 > µ2 Ha: µ1 – µ2 > 0
The words "older than" translates as a “>” symbol and goes into Ha. Therefore, this is a right-tailed test.
「より年齢が高い」は「>」で表し、Haに入る。したがって、これは右片側検定である。
Distribution for the test: The distribution is the normal approximation to the Student’s t for means, independent groups. Using the formula, the distribution is:
検定の分布:独立した集団の平均に対するスチューデントのt分布を正規分布で近似する。公式を使うと、分布はとなる。
Since µ1 ≤ µ2, µ1 – µ2 ≤ 0 and the mean for the normal distribution is zero.
µ1 ≤ µ2なので、µ1 – µ2 ≤ 0であり、正規分布の平均は0である。
(Calculating the p-value using the normal distribution gives p-value = 0.4955)
(正規分布で計算すると、p値 = 0.4955となる。)
Graph:
グラフ:
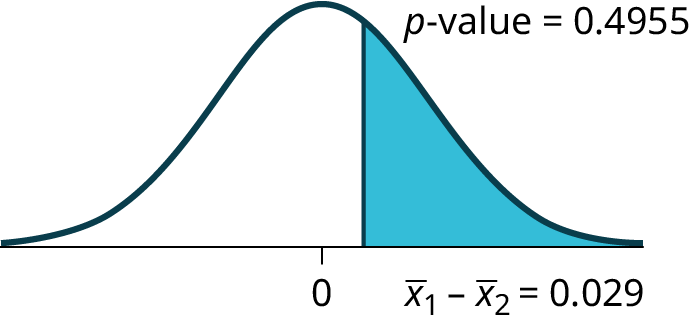


Figure 10.6図 10.6
Compare α and the p-value: α = 0.05 and p-value = 0.4955. Therefore, α < p-value.
αとp値を比較する。α = 0.05、p値 = 0.4955。したがってα < p値。
Make a decision: Since α < p-value, do not reject H0.
判断する:α < p値なので、H0を棄却しない。
Conclusion: At the 5% level of significance, from the sample data, there is not sufficient evidence to conclude that the mean age of Democratic senators is greater than the mean age of the Republican senators.
結論:有意水準5%では、標本データから、民主党の上院議員の平均年齢は共和党より高いと結論づける証拠は不十分である。