第10章2標本による仮説検定
10.1 Two Population Means with Unknown Standard Deviations10.1 標準偏差が未知の2つの母平均
- The two independent samples are simple random samples from two distinct populations.2つの独立標本は、それぞれ異なる母集団から抽出した単純無作為標本である。
- For the two distinct populations:2つの異なる母集団について:
- if the sample sizes are small, the distributions are important (should be normal)標本が小さい場合、分布が重要になる(正規分布であるべきである)。
- if the sample sizes are large, the distributions are not important (need not be normal)標本が大きい場合、分布は重要ではない(正規分布である必要はない)。
The comparison of two population means is very common. A difference between the two samples depends on both the means and the standard deviations. Very different means can occur by chance if there is great variation among the individual samples. In order to account for the variation, we take the difference of the sample means, – , and divide by the standard error in order to standardize the difference. The result is a t-score test statistic.
英語のヒント
2つの母平均の比較は非常によく行われる。2つの標本の違いは、平均と標準偏差の両方に依存する。各標本の値のばらつきが大きい場合、偶然によって平均が大きく異なることもある。そのばらつきを考慮するため、標本平均の差 – を取り、標準誤差で割って標準化する。こうして得られるのがt得点の検定統計量である。
Because we do not know the population standard deviations, we estimate them using the two sample standard deviations from our independent samples. For the hypothesis test, we calculate the estimated standard deviation, or standard error, of the difference in sample means, – .
母標準偏差は不明なので、独立標本から得た2つの標本標準偏差を使って推定する。仮説検定のために、標本平均の差 – の標準偏差の推定値、すなわち標準誤差を計算する。
The standard error is:標準誤差は次のとおりである。
The test statistic (t-score) is calculated as follows:
検定統計量(t得点)は次のように計算する。
- s1 and s2, the sample standard deviations, are estimates of σ1 and σ2, respectively.標本標準偏差s1とs2は、それぞれσ1とσ2の推定値である。
- σ1 and σ2 are the unknown population standard deviations.σ1とσ2は未知の母標準偏差である。
- and are the sample means. μ1 and μ2 are the population means.とは標本平均である。μ1とμ2は母平均である。
where:ここで、
The number of degrees of freedom (df) requires a somewhat complicated calculation. However, a computer or calculator calculates it easily. The df are not always a whole number. The test statistic calculated previously is approximated by the Student's t-distribution with df as follows:
自由度(df)を求めるには、やや複雑な計算が必要である。しかし、コンピューターや電卓なら簡単に計算できる。dfは必ずしも整数ではない。先ほど求めた検定統計量は、次の自由度dfを持つスチューデントのt分布で近似される。
Degrees of freedom自由度
When both sample sizes n1 and n2 are five or larger, the Student's t approximation is very good. Notice that the sample variances (s1)2 and (s2)2 are not pooled. (If the question comes up, do not pool the variances.)
英語のヒント
標本の大きさn1とn2がどちらも5以上であれば、スチューデントのt分布による近似は非常によい。標本分散(s1)2と(s2)2をプールしないことに注意する。(選択を求められても、分散をプールしてはならない。)
Example 10.1例題 10.1
Independent groups独立した集団
The average amount of time boys and girls aged seven to 11 spend playing sports each day is believed to be the same. A study is done and data are collected, resulting in the data in Table 10.1. Each populations has a normal distribution.
7~11歳の男子と女子が1日にスポーツをする平均時間は同じだと考えられている。研究でデータを集め、表10.1の結果を得た。各母集団は正規分布に従う。
Sample Size 標本の大きさ |
Average Number of Hours Playing Sports Per Day 1日にスポーツをする平均時間 |
Sample Standard Deviation 標本標準偏差 |
|
|---|---|---|---|
Girls 女子 |
9 |
2 |
|
Boys 男子 |
16 |
3.2 |
1.00 |
Is there a difference in the mean amount of time boys and girls aged seven to 11 play sports each day? Test at the 5% level of significance.
7~11歳の男子と女子では、1日にスポーツをする平均時間に違いがあるか。有意水準5%で検定せよ。
Solution解き方
The population standard deviations are not known. Let g be the subscript for girls and b be the subscript for boys. Then, μg is the population mean for girls and μb is the population mean for boys. This is a test of two independent groups, two population means.
母標準偏差は不明である。女子の添字をg、男子の添字をbとする。するとμgは女子の母平均、μbは男子の母平均となる。これは、独立した2集団の2つの母平均の検定である。
Random variable: = difference in the sample mean amount of time girls and boys play sports each day.
H0: μg = μb H0: μg – μb = 0
Ha: μg ≠ μb Ha: μg – μb ≠ 0
The words "the same" tell you H0 has an "=". Since there are no other words to indicate Ha, assume it says "is different." This is a two-tailed test.
H0: μg = μb H0: μg – μb = 0
Ha: μg ≠ μb Ha: μg – μb ≠ 0
The words "the same" tell you H0 has an "=". Since there are no other words to indicate Ha, assume it says "is different." This is a two-tailed test.
確率変数: = 女子と男子が1日にスポーツをする時間の標本平均の差。H0:μg = μb。H0:μg – μb = 0。Ha:μg ≠ μb。Ha:μg – μb ≠ 0。「同じ」という言葉から、H0には「=」が入る。Haを指定するほかの言葉はないため、「異なる」と仮定する。これは両側検定である。
Distribution for the test: Use tdf where df is calculated using the df formula for independent groups, two population means. Using a calculator, df is approximately 18.8462. Do not pool the variances.
検定の分布:tdfを用いる。dfは独立した2集団の2つの母平均に対する自由度の公式で求める。電卓を使うと、dfは約18.8462となる。分散はプールしない。
Calculate the p-value using a Student's t-distribution: p-value = 0.0054
スチューデントのt分布を使ってp値を計算する。p値 = 0.0054。
Graph:
グラフ:
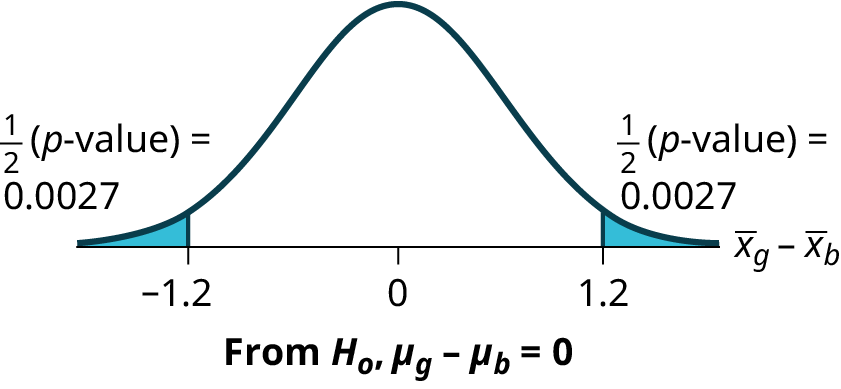
Figure 10.2図 10.2
So, = 2 – 3.2 = –1.2
Half the p-value is below –1.2 and half is above 1.2.
、。したがって、 = 2 – 3.2 = −1.2。p値の半分が−1.2より下側、半分が1.2より上側にある。
Make a decision: Since α > p-value, reject H0. This means you reject μg = μb. The means are different.
判断:α > p値なので、H0を棄却する。つまりμg = μbを棄却する。平均は異なる。
Using the Calculator電卓の操作
Conclusion: At the 5% level of significance, the sample data show there is sufficient evidence to conclude that the mean number of hours that girls and boys aged seven to 11 play sports per day is different (mean number of hours boys aged seven to 11 play sports per day is greater than the mean number of hours played by girls OR the mean number of hours girls aged seven to 11 play sports per day is greater than the mean number of hours played by boys).
結論:有意水準5%では、標本データから、7~11歳の男子と女子が1日にスポーツをする平均時間は異なると結論づける十分な証拠がある(男子の平均時間が女子より長い、または女子の平均時間が男子より長い)。
Example 10.2例題 10.2
A study is done by a community group in two neighboring colleges to determine which one graduates students with more math classes. College A samples 11 graduates. Their average is four math classes with a standard deviation of 1.5 math classes. College B samples nine graduates. Their average is 3.5 math classes with a standard deviation of one math class. The community group believes that a student who graduates from college A has taken more math classes, on the average. Both populations have a normal distribution. Test at a 1% significance level. Answer the following questions.
地域団体が、近隣の2大学のうち、どちらの卒業生が数学の授業を多く履修しているかを調査する。大学Aは卒業生11人を標本とし、平均履修数4科目、標準偏差1.5科目を得た。大学Bは卒業生9人を標本とし、平均履修数3.5科目、標準偏差1科目を得た。地域団体は、大学Aの卒業生のほうが平均で多くの数学の授業を履修していると考えている。両母集団は正規分布に従う。有意水準1%で検定せよ。以下の問いに答えよ。
a. Is this a test of two means or two proportions?
a. これは2つの平均の検定か、2つの割合の検定か。
Solution解き方
a. two means
a. 2つの平均。
b. Are the populations standard deviations known or unknown?
b. 母標準偏差は既知か、未知か。
Solution解き方
b. unknown
b. 未知。
c. Which distribution do you use to perform the test?
c. 検定にはどの分布を使うか。
Solution解き方
c. Student's t
c. スチューデントのt分布。
d. What is the random variable?
d. 確率変数は何か。
Solution解き方
d.
e. What are the null and alternate hypotheses? Write the null and alternate hypotheses in words and in symbols.
e. 帰無仮説と対立仮説は何か。言葉と記号で書け。
Solution解き方
e.
f. Is this test right-, left-, or two-tailed?
f. これは右片側、左片側、両側のどの検定か。
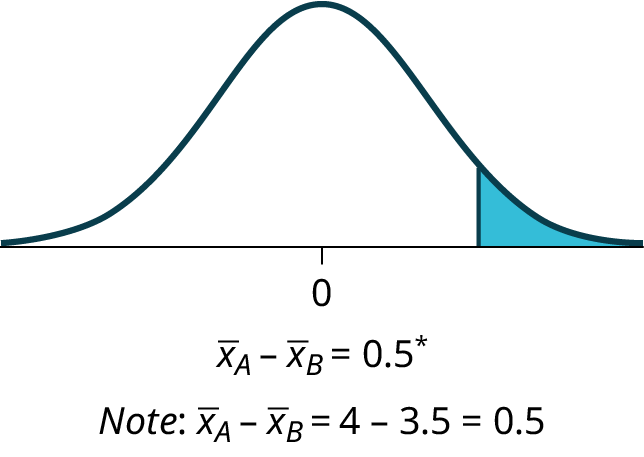
g. What is the p-value?
g. p値はいくらか。
Solution解き方
g. 0.1928
h. Do you reject or not reject the null hypothesis?
h. 帰無仮説を棄却するか、棄却しないか。
Solution解き方
h. Do not reject.
h. 棄却しない。
i. Conclusion:
i. 結論:
Solution解き方
i. At the 1% level of significance, from the sample data, there is not sufficient evidence to conclude that a student who graduates from college A has taken more math classes, on the average, than a student who graduates from college B.
i. 有意水準1%では、標本データから、大学Aの卒業生は大学Bの卒業生より平均して多くの数学の授業を履修していると結論づける証拠は不十分である。
Example 10.3例題 10.3
A professor at a large community college wanted to determine whether there is a difference in the means of final exam scores between students who took his statistics course online and the students who took his face-to-face statistics class. He believed that the mean of the final exam scores for the online class would be lower than that of the face-to-face class. Was the professor correct? The randomly selected 30 final exam scores from each group are listed in Table 10.3 and Table 10.4.
英語のヒント
67.6 |
41.2 |
85.3 |
55.9 |
82.4 |
91.2 |
73.5 |
94.1 |
64.7 |
64.7 |
70.6 |
38.2 |
61.8 |
88.2 |
70.6 |
58.8 |
91.2 |
73.5 |
82.4 |
35.5 |
94.1 |
88.2 |
64.7 |
55.9 |
88.2 |
97.1 |
85.3 |
61.8 |
79.4 |
79.4 |
77.9 |
95.3 |
81.2 |
74.1 |
98.8 |
88.2 |
85.9 |
92.9 |
87.1 |
88.2 |
69.4 |
57.6 |
69.4 |
67.1 |
97.6 |
85.9 |
88.2 |
91.8 |
78.8 |
71.8 |
98.8 |
61.2 |
92.9 |
90.6 |
97.6 |
100 |
95.3 |
83.5 |
92.9 |
89.4 |
Is the mean of the Final Exam scores of the online class lower than the mean of the Final Exam scores of the face-to-face class? Test at a 5% significance level. Answer the following questions:
オンライン授業の期末試験の平均点は、対面授業の期末試験の平均点より低いか。有意水準5%で検定せよ。以下の問いに答えよ。
- Is this a test of two means or two proportions?これは2つの平均の検定か、2つの比率の検定か。
- Are the population standard deviations known or unknown?母標準偏差は既知か、未知か。
- Which distribution do you use to perform the test?検定にはどの分布を使うか。
- What is the random variable?確率変数は何か。
- What are the null and alternative hypotheses? Write the null and alternative hypotheses in words and in symbols.帰無仮説と対立仮説は何か。それぞれを言葉と記号で書く。
- Is this test right, left, or two tailed?これは右片側、左片側、両側のどの検定か。
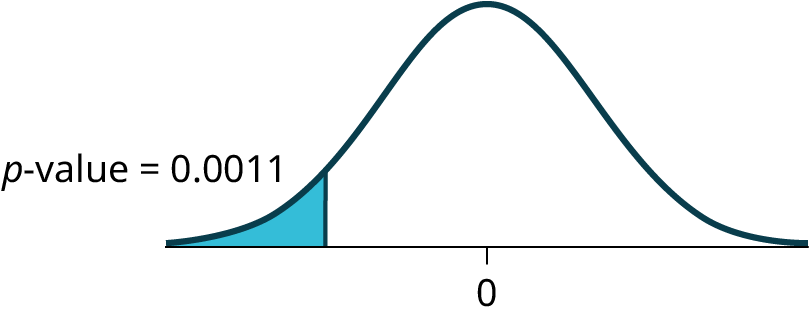
- What is the p-value?p値はいくつか。
- Do you reject or not reject the null hypothesis?帰無仮説を棄却するか、棄却しないか。
- At the ___ level of significance, from the sample data, there ______ (is/is not) sufficient evidence to conclude that ______.有意水準___では、標本データから、______と結論づける十分な証拠が______(ある/ない)。
(See the conclusion in Example 10.2, and write yours in a similar fashion)
(例10.2の結論を参照し、同じような形で自分の結論を書け。)
Solution解き方
- two means2つの平均。
- unknown未知
- Student's tスチューデントのt分布。
- H0: μ1 = μ2 Null hypothesis: the means of the final exam scores are equal for the online and face-to-face statistics classes.H0:μ1 = μ2。帰無仮説:オンラインと対面の統計学授業では、期末試験の平均点は等しい。
- Ha: μ1 < μ2 Alternative hypothesis: the mean of the final exam scores of the online class is less than the mean of the final exam scores of the face-to-face class.Ha:μ1 < μ2。対立仮説:オンライン授業の期末試験の平均点は、対面授業の平均点より低い。
- left-tailed左片側。
- p-value = 0.0011p値 = 0.0011Figure 10.4図 10.4
- Reject the null hypothesis帰無仮説を棄却する。
- The professor was correct. The evidence shows that the mean of the final exam scores for the online class is lower than that of the face-to-face class.
At the 5% level of significance, from the sample data, there is (is/is not) sufficient evidence to conclude that the mean of the final exam scores for the online class is less than the mean of final exam scores of the face-to-face class.教授の考えは正しかった。証拠は、オンライン授業の期末試験の平均点が対面授業より低いことを示す。有意水準5%では、標本データから、オンライン授業の期末試験の平均点は対面授業より低いと結論づける十分な証拠がある(ある/ない)。


Using the Calculator電卓の操作
Cohen's Standards for Small, Medium, and Large Effect Sizes効果量の小・中・大を判断するコーエンの基準
Cohen's d is a measure of effect size based on the differences between two means. Cohen’s d, named for United States statistician Jacob Cohen, measures the relative strength of the differences between the means of two populations based on sample data. The calculated value of effect size is then compared to Cohen’s standards of small, medium, and large effect sizes.
英語のヒント
コーエンのdは、2つの平均の差に基づく効果量の指標である。米国の統計学者ジェイコブ・コーエンにちなんで名付けられ、標本データに基づいて2つの母平均の差の相対的な大きさを測る。計算された効果量を、コーエンの小・中・大の効果量の基準と比較する。
Size of effect 効果の大きさ |
d |
|---|---|
Small 小 |
0.2 |
medium 中 |
0.5 |
Large 大 |
0.8 |
Cohen's d is the measure of the difference between two means divided by the pooled standard deviation: where
コーエンのdは、2つの平均の差をプールした標準偏差で割った指標である:。ここで。
Example 10.4例題 10.4
Calculate Cohen’s d for Example 10.2. Is the size of the effect small, medium, or large? Explain what the size of the effect means for this problem.
例10.2のコーエンのdを計算せよ。効果の大きさは小・中・大のどれか。この問題で効果の大きさが何を意味するか説明せよ。
Solution解き方
μ1 = 4 s1 = 1.5 n1 = 11
μ2 = 3.5 s2 = 1 n2 = 9
d = 0.384
The effect is small because 0.384 is between Cohen’s value of 0.2 for small effect size and 0.5 for medium effect size. The size of the differences of the means for the two colleges is small indicating that there is not a significant difference between them.
μ2 = 3.5 s2 = 1 n2 = 9
d = 0.384
The effect is small because 0.384 is between Cohen’s value of 0.2 for small effect size and 0.5 for medium effect size. The size of the differences of the means for the two colleges is small indicating that there is not a significant difference between them.
μ1 = 4、s1 = 1.5、n1 = 11、μ2 = 3.5、s2 = 1、n2 = 9、d = 0.384。0.384は、コーエンの小さい効果量の基準0.2と中程度の基準0.5の間なので、効果は小さい。2大学の平均の差は小さく、両者に有意な違いがないことを示す。
Example 10.5例題 10.5
Calculate Cohen’s d for Example 10.3. Is the size of the effect small, medium or large? Explain what the size of the effect means for this problem.
例10.3のコーエンのdを計算せよ。効果の大きさは小・中・大のどれか。この問題で効果の大きさが何を意味するか説明せよ。
Solution解き方
d = 0.834; Large, because 0.834 is greater than Cohen’s 0.8 for a large effect size. The size of the differences between the means of the Final Exam scores of online students and students in a face-to-face class is large indicating a significant difference.
d = 0.834。大きな効果である。0.834が、コーエンの大きい効果量の基準0.8を超えるからだ。オンライン受講生と対面授業の受講生の期末試験の平均点の差は大きく、有意な違いを示す。