第10章2標本による仮説検定
Homework宿題
Exercises 84–87練習問題 84–87
DIRECTIONS: For each of the word problems, use a solution sheet to do the hypothesis test. The solution sheet is found in Solution Sheets. Please feel free to make copies of the solution sheets. For the online version of the book, it is suggested that you copy the .doc or the .pdf files.
指示:各文章題について、解答用紙を使って仮説検定を行え。解答用紙は「解答用紙」にある。自由に複写してよい。本書のオンライン版では、.docファイルまたは.pdfファイルをコピーするとよい。
Exercise 84問題 84
A recent drug survey showed an increase in the use of drugs and alcohol among local high school seniors as compared to the national percent. Suppose that a survey of 100 local seniors and 100 national seniors is conducted to see if the proportion of drug and alcohol use is higher locally than nationally. Locally, 65 seniors reported using drugs or alcohol within the past month, while 60 national seniors reported using them.
最近の薬物調査で、地元の高校最終学年の生徒は全国の割合より薬物やアルコールの使用が多いと示された。地元の使用割合が全国より高いかを調べるため、それぞれ100人を調査するとする。過去1か月以内に薬物またはアルコールを使用したと答えたのは、地元65人、全国60人だった。
Exercise 85問題 85
We are interested in whether the proportions of conferred physical science degrees for people aged 21 to 24 are the same for White and Black people in the United States. The number of conferred degrees for White people in a given year is 4,930. Five hundred eighty were aged 21 to 24. The estimate for Black people is 330. Forty were aged 21 to 24. We will let people with conferred physical science degrees be our population.
英語のヒント
米国で物理科学の学位を取得した人のうち、21~24歳の割合が白人と黒人で同じかどうかに関心がある。ある年に白人が取得した学位は4,930件で、そのうち580人が21~24歳だった。黒人の推定取得数は330件で、そのうち40人が21~24歳だった。物理科学の学位を取得した人を母集団とする。
Solution解き方
- H0: PW = PB
- Ha: PW ≠ PB
- The random variable is the difference in the proportions of White and Black people with conferred degrees in a given year, aged 21 to 24.確率変数は、その年の学位取得者のうち21~24歳である人の割合について、白人と黒人の差である。
- normal for two proportions2つの比率に対する正規分布
- test statistic: –0.1944検定統計量:−0.1944
- p-value: 0.8458p値:0.8458
- Answers may vary.解答はさまざまである。
- Alpha: 0.05α:0.05
- Decision: Reject the null hypothesis.判断:帰無仮説を棄却する。
- Reason for decision: p-value > alpha判断の理由:p値 > α。
- Conclusion: At the 5% significance level, there is insufficient evidence to conclude that the proportions of White and Black people with conferred physical science degrees, aged 21 to 24, are different.結論:有意水準5%では、物理科学の学位取得者のうち21~24歳である人の割合は白人と黒人で異なると結論づける証拠は不十分である。
Exercise 86問題 86
Elizabeth Mjelde, an art history professor, was interested in whether the value from the Golden Ratio formula, was the same in the Whitney Exhibit for works from 1900 to 1919 as for works from 1920 to 1942. Thirty-seven early works were sampled, averaging 1.74 with a standard deviation of 0.11. Sixty-five of the later works were sampled, averaging 1.746 with a standard deviation of 0.1064. Do you think that there is a significant difference in the Golden Ratio calculation?
美術史の教授エリザベス・ミェルデは、ホイットニー美術館展において、黄金比の公式から得られる値が、1900~1919年の作品と1920~1942年の作品で同じかどうかに関心を持った。初期の作品37点を標本にすると、平均1.74、標準偏差0.11だった。後期の作品65点では、平均1.746、標準偏差0.1064だった。黄金比の計算値に有意な差があると思うか。
Exercise 87問題 87
A recent year was randomly picked from 1985 to the present. In that year, there were 2,051 Hispanic/Latino students at Cabrillo College out of a total of 12,328 students. At Lake Tahoe College, there were 321 Hispanic/Latino students out of a total of 2,441 students. In general, do you think that the percent of Hispanic/Latino students at the two colleges is basically the same or different?
1985年から現在までの間から、最近のある年を無作為に選んだ。その年、カブリロ・カレッジでは総学生数12,328人のうち2,051人がヒスパニック/ラティーノだった。レイクタホ・カレッジでは2,441人中321人だった。一般に、この2校のヒスパニック/ラティーノの学生の割合は基本的に同じだと思うか、それとも異なると思うか。
Solution解き方
Subscripts: 1 = Cabrillo College, 2 = Lake Tahoe College
添字:1 = カブリロ・カレッジ、2 = レイクタホ・カレッジ。
- H0: p1 = p2
- Ha: p1 ≠ p2
- The random variable is the difference between the proportions of Hispanic/Latino students at Cabrillo College and Lake Tahoe College.確率変数は、カブリロ・カレッジとレイクタホ・カレッジのヒスパニック/ラティーノの学生の割合の差である。
- normal for two proportions2つの比率に対する正規分布
- test statistic: 4.29検定統計量:4.29
- p-value: 0.00002p値:0.00002
- Answers may vary.解答はさまざまである。
- Alpha: 0.05α:0.05
- Decision: Reject the null hypothesis.判断:帰無仮説を棄却する。
- Reason for decision: p-value < alpha判断の理由:p値 < α
- Conclusion: There is sufficient evidence to conclude that the proportions of Hispanic/Latino students at Cabrillo College and Lake Tahoe College are different.結論:カブリロ・カレッジとレイクタホ・カレッジのヒスパニック/ラティーノの学生の割合は異なると結論づける十分な証拠がある。
Exercises 88–99練習問題 88–99
Use the following information to answer the next three exercises. Some individuals who were exposed to the COVID-19 virus experienced a loss of taste. In a sample of COVID patients during 2022, there were 629 reported cases of loss of taste out of a total of 1,021 reported cases. In 2021, there were 486 reported cases of loss of taste out of a sample of 712 cases. Is the 2022 proportion of loss of taste more than the 2021 proportion? Using a 1% level of significance, conduct an appropriate hypothesis test.
英語のヒント
以下の情報を用いて次の3問に答えよ。新型コロナウイルスにさらされた人の一部は味覚の喪失を経験した。2022年のCOVID-19患者の標本では、報告された1,021例中629例で味覚の喪失が報告された。2021年の712例の標本では486例だった。2022年の味覚喪失の割合は2021年より高いか。有意水準1%で適切な仮説検定を行え。
- “2022” subscript: 2022 group.添字2022:2022年の群。
- “2021” subscript: 2021 group添字2021:2021年の群。
Exercise 88問題 88
This is:
これは次のどれか。
- a test of two proportions2つの割合の検定。
- a test of two independent means独立した2つの平均の検定。
- a test of a single mean1つの平均の検定。
- a test of matched pairs.対応のある標本の検定。
Exercise 89問題 89
An appropriate null hypothesis is:
適切な帰無仮説は次のどれか。
Solution解き方
a
Exercise 90問題 90
The p-value is 0.0022. At a 1% level of significance, the appropriate conclusion is
p値は0.0022である。有意水準1%で、適切な結論は次のどれか。
- There is sufficient evidence to conclude that the proportion of people in the United States in 2022 who experienced loss of taste is less than the proportion of people in the United States in 2021 who experienced loss of taste.米国で味覚の喪失を経験した人の割合は、2022年のほうが2021年より低いと結論づける十分な証拠がある。
- There is insufficient evidence to conclude that the proportion of people in the United States in 2022 who experienced loss of taste is more than the proportion of people in the United States in 2021 who experienced loss of taste.米国で味覚の喪失を経験した人の割合は、2022年のほうが2021年より高いと結論づける証拠は不十分である。
- There is insufficient evidence to conclude that the proportion of people in the United States in 2022 who experienced loss of taste is less than the proportion of people in the United States in 2021 who experienced loss of taste.米国で味覚の喪失を経験した人の割合は、2022年のほうが2021年より低いと結論づける証拠は不十分である。
- There is sufficient evidence to conclude that the proportion of people in the United States in 2022 who experienced loss of taste is more than the proportion of people in the United States in 2021 who experienced loss of taste.米国で味覚の喪失を経験した人の割合は、2022年のほうが2021年より高いと結論づける十分な証拠がある。
Exercise 91問題 91
Researchers conducted a study to find out if there is a difference in the use of eReaders by different age groups. Randomly selected participants were divided into two age groups. In the 16- to 29-year-old group, 7% of the 628 surveyed use eReaders, while 11% of the 2,309 participants 30 years old and older use eReaders.
英語のヒント
研究者が、電子書籍端末の利用に年齢層による違いがあるかを調べた。無作為に選んだ参加者を2つの年齢層に分けた。16~29歳では調査した628人の7%が、30歳以上では2,309人の11%が電子書籍端末を使っていた。
Solution解き方
Test: two independent sample proportions.
検定:独立した2標本の割合。
Random variable: p′1 - p′2
確率変数:p′1 − p′2
Distribution:
H0: p1 = p2
Ha: p1 ≠ p2
H0: p1 = p2
Ha: p1 ≠ p2
分布:H0:p1 = p2。Ha:p1 ≠ p2。
The proportion of eReader users is different for the 16- to 29-year-old users from that of the 30 and older users.
電子書籍端末の利用者の割合は、16~29歳と30歳以上で異なる。
Graph: two-tailed
グラフ:両側。
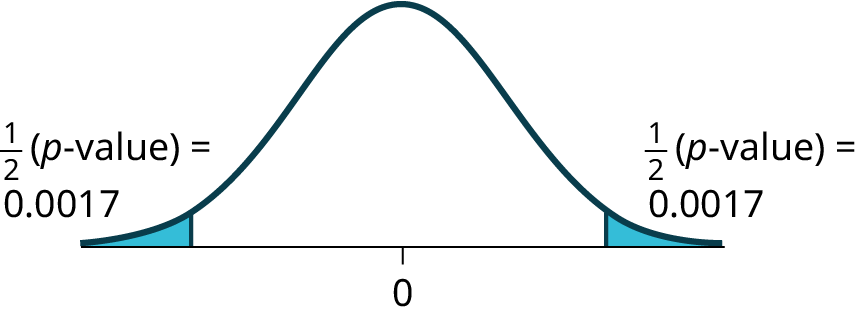
Figure 10.12図 10.12
p-value : 0.0033
p値:0.0033
Decision: Reject the null hypothesis.
判断:帰無仮説を棄却する。
Conclusion: At the 5% level of significance, from the sample data, there is sufficient evidence to conclude that the proportion of eReader users 16 to 29 years old is different from the proportion of eReader users 30 and older.
結論:有意水準5%では、標本データから、電子書籍端末の利用者の割合は16~29歳と30歳以上で異なると結論づける十分な証拠がある。
Exercise 92問題 92
Adults aged 18 years old and older were randomly selected for a survey on working from home. The researchers wanted to determine if the proportion of women who work from home is less than the proportion of men who work from home. The results are shown in Table 10.20. Test at the 1% level of significance.
在宅勤務に関する調査のため、18歳以上の成人を無作為に選んだ。研究者は、在宅勤務をする女性の割合は男性より低いかどうかを知りたかった。結果を表10.20に示す。有意水準1%で検定せよ。
Number who work from home 在宅勤務をする人数 |
Sample size 標本の大きさ |
|
|---|---|---|
Men 男性 |
42,769 |
155,525 |
Women 女性 |
67,169 |
248,775 |
Exercise 93問題 93
Two computer users were discussing tablet computers. A higher proportion of people ages 16 to 29 use tablets than the proportion of people age 30 and older. Table 10.21 details the number of tablet owners for each age group. Test at the 1% level of significance.
2人のコンピューター利用者がタブレットについて話していた。16~29歳のタブレット利用割合は30歳以上より高いという。表10.21に各年齢層の所有者数を示す。有意水準1%で検定せよ。
16–29 year olds 16~29歳 |
30 years old and older 30歳以上 |
|
|---|---|---|
Own a Tablet タブレットを所有する |
69 |
231 |
Sample Size 標本の大きさ |
628 |
2,309 |
Solution解き方
Test: two independent sample proportions
検定:独立した2標本の割合。
Random variable: p′1 − p′2
確率変数:p′1 − p′2
Distribution:
分布:
H0: p1 = p2
Ha: p1 > p2
Ha: p1 > p2
H0:p1 = p2。Ha:p1 > p2。
A higher proportion of tablet owners are aged 16 to 29 years old than are 30 years old and older.
タブレット所有者の割合は、16~29歳のほうが30歳以上より高い。
Graph: right-tailed
グラフ:右片側。
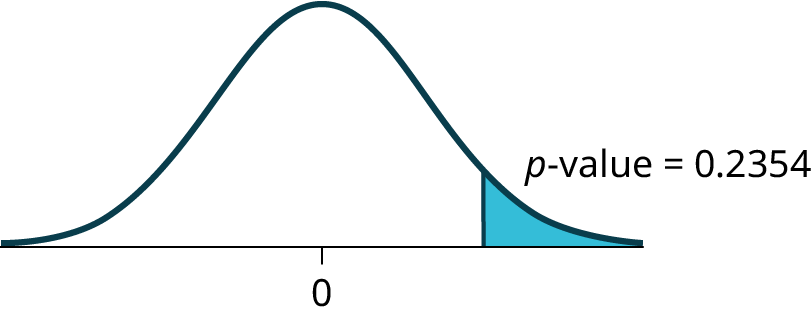


Figure 10.13図 10.13
p-value: 0.2354
p値:0.2354
Decision: Do not reject the H0.
判断:H0を棄却しない。
Conclusion: At the 1% level of significance, from the sample data, there is not sufficient evidence to conclude that a higher proportion of tablet owners are aged 16 to 29 years old than are 30 years old and older.
結論:有意水準1%では、標本データから、タブレット所有者の割合は16~29歳のほうが30歳以上より高いと結論づける証拠は不十分である。
Exercise 94問題 94
A group of friends debated whether more people aged 21-30 use wearable fitness devices than people aged 31-40. They consulted a research study of wearable fitness devices use among adults. The results of the survey indicate that of the 973 randomly sampled people in their twenties, 379 use wearable fitness devices. For people in their thirties, 404 of the 1,304 who were randomly sampled use wearable fitness devices. Test at the 5% level of significance.
英語のヒント
友人たちが、21~30歳の人は31~40歳の人より、身に着けるフィットネス機器を多く利用しているかどうかを議論した。成人のウェアラブル・フィットネス機器の利用に関する研究を調べたところ、無作為に抽出された20代973人中379人が使用していた。30代では無作為に抽出された1,304人中404人が使用していた。有意水準5%で検定せよ。
Exercise 95問題 95
While her husband spent 2½ hours picking out new speakers, a statistician decided to determine whether the percent of men who enjoy shopping for electronic equipment is higher than the percent of women who enjoy shopping for electronic equipment. The population was Saturday afternoon shoppers. Out of 67 men, 24 said they enjoyed the activity. Eight of the 24 women surveyed claimed to enjoy the activity. Interpret the results of the survey.
英語のヒント
夫が新しいスピーカー選びに2時間半をかけている間に、ある統計学者は電子機器の買い物を楽しむ人の割合は男性のほうが女性より高いかどうかを調べることにした。母集団は土曜日の午後の買い物客だった。男性67人中24人、調査した女性24人中8人が、電子機器の買い物を楽しむと答えた。調査結果を解釈せよ。
Solution解き方
Subscripts: 1: men; 2: women
添字:1は男性、2は女性。
- H0: p1 ≤ p2
- Ha: p1 > p2
- is the difference between the proportions of men and women who enjoy shopping for electronic equipment.は、電子機器の買い物を楽しむ男性と女性の割合の差である。
- normal for two proportions2つの比率に対する正規分布
- test statistic: 0.22検定統計量:0.22
- p-value: 0.4133p値:0.4133
- Answers may vary.解答はさまざまである。
- Alpha: 0.05α:0.05
- Decision: Do not reject the null hypothesis.判断:帰無仮説を棄却しない。
- Reason for Decision: p-value > alpha判断の理由:p値 > α
- Conclusion: At the 5% significance level, there is insufficient evidence to conclude that the proportion of men who enjoy shopping for electronic equipment is more than the proportion of women.結論:有意水準5%では、電子機器の買い物を楽しむ人の割合は男性のほうが女性より高いと結論づける証拠は不十分である。
Exercise 96問題 96
We are interested in whether children’s educational computer software costs less, on average, than children’s entertainment software. Thirty-six educational software titles were randomly picked from a catalog. The mean cost was $31.14 with a standard deviation of $4.69. Thirty-five entertainment software titles were randomly picked from the same catalog. The mean cost was $33.86 with a standard deviation of $10.87. Decide whether children’s educational software costs less, on average, than children’s entertainment software.
子ども向け教育ソフトウェアは、娯楽用ソフトウェアより平均価格が低いかどうかに関心がある。カタログから教育ソフト36点を無作為に選ぶと、平均価格は31.14ドル、標準偏差は4.69ドルだった。同じカタログから娯楽ソフト35点を無作為に選ぶと、平均価格は33.86ドル、標準偏差は10.87ドルだった。教育ソフトのほうが平均価格は低いか判断せよ。
Exercise 97問題 97
Joan Nguyen recently claimed that the proportion of college-age men with at least one pierced ear is as high as the proportion of college-age women. She conducted a survey in her classes. Out of 107 men, 20 had at least one pierced ear. Out of 92 women, 47 had at least one pierced ear. Do you believe that the proportion of men has reached the proportion of women?
ジョーン・グエンは最近、少なくとも片耳にピアスの穴を開けた大学生くらいの年齢の男性の割合は、同年齢の女性と同じくらい高いと主張した。自分のクラスで調べると、男性107人中20人、女性92人中47人に少なくとも片耳のピアス穴があった。男性の割合は女性の割合に達したと考えるか。
Solution解き方
- H0: p1 = p2
- Ha: p1 ≠ p2
- is the difference between the proportions of men and women that have at least one pierced ear.は、少なくとも片耳にピアスの穴がある男性と女性の割合の差である。
- normal for two proportions2つの比率に対する正規分布
- test statistic: –4.82検定統計量:−4.82
- p-value: zerop値:0
- Answers may vary.解答はさまざまである。
- Alpha: 0.05α:0.05
- Decision: Reject the null hypothesis.判断:帰無仮説を棄却する。
- Reason for Decision: p-value < alpha判断の理由:p値 < α
- Conclusion: At the 5% significance level, there is sufficient evidence to conclude that the proportions of men and women with at least one pierced ear is different.結論:有意水準5%では、少なくとも片耳にピアスの穴がある人の割合は男女で異なると結論づける十分な証拠がある。
Exercise 98問題 98
Exercise 99問題 99
"To Breakfast or Not to Breakfast?" by Richard Ayore
「朝食を食べるべきか、食べざるべきか」リチャード・アヨレ作
In the American society, birthdays are one of those days that everyone looks forward to. People of different ages and peer groups gather to mark the 18th, 20th, …, birthdays. During this time, one looks back to see what they have achieved for the past year and also focuses ahead for more to come.
米国社会では、誕生日は誰もが楽しみにする日の一つだ。いろいろな年齢や仲間の集団が集まり、18歳、20歳、…の誕生日を祝う。この時期には、過去1年間で何を成し遂げたかを振り返り、これからのことにも目を向ける。
If, by any chance, I am invited to one of these parties, my experience is always different. Instead of dancing around with my friends while the music is booming, I get carried away by memories of my family back home in Kenya. I remember the good times I had with my brothers and sister while we did our daily routine.
英語のヒント
私がたまたまこうしたパーティーに招かれると、いつも違う体験になる。音楽が鳴り響く中で友達と踊る代わりに、故郷ケニアの家族の思い出に心を奪われるのだ。兄弟や姉妹と日々の仕事をしながら過ごした、楽しい時を思い出す。
Every morning, I remember we went to the shamba (garden) to weed our crops. I remember one day arguing with my brother as to why he always remained behind just to join us an hour later. In his defense, he said that he preferred waiting for breakfast before he came to weed. He said, “This is why I always work more hours than you guys!”
英語のヒント
毎朝、畑(シャンバ)に行って作物の草取りをしたのを覚えている。ある日、なぜ兄弟の一人がいつも居残って、1時間後になって加わるのかと言い争った。彼の言い分は、朝食を待ってから草取りに行きたいというものだった。「だからいつも、お前たちより長い時間働けるんだ」と彼は言った。
And so, to prove him wrong or right, we decided to give it a try. One day we went to work as usual without breakfast, and recorded the time we could work before getting tired and stopping. On the next day, we all ate breakfast before going to work. We recorded how long we worked again before getting tired and stopping. Of interest was our mean increase in work time. Though not sure, my brother insisted that it was more than two hours. Using the data in Table 10.22, solve our problem.
英語のヒント
彼が正しいかどうか確かめるため、試してみることにした。ある日はいつもどおり朝食を取らずに働き、疲れてやめるまでの時間を記録した。翌日は全員が朝食を取ってから働き、また疲れてやめるまでの時間を記録した。関心があったのは、働ける時間の平均増加量である。確信はなかったが、彼は2時間を超えるはずだと言い張った。表10.22のデータを使い、この問題を解いてほしい。
Work hours with breakfast 朝食ありの労働時間 |
Work hours without breakfast 朝食なしの労働時間 |
|---|---|
8 |
6 |
7 |
5 |
9 |
5 |
5 |
4 |
9 |
7 |
8 |
7 |
10 |
7 |
7 |
5 |
6 |
6 |
9 |
5 |
Solution解き方
- H0: µd = 0
- Ha: µd > 0
- The random variable Xd is the mean difference in work times on days when eating breakfast and on days when not eating breakfast.確率変数Xdは、朝食を食べた日と食べなかった日の労働時間の平均差である。
- t9
- test statistic: 4.8963検定統計量:4.8963
- p-value: 0.0004p値:0.0004
- Answers may vary.解答はさまざまである。
- Alpha: 0.05α:0.05
- Decision: Reject the null hypothesis.判断:帰無仮説を棄却する。
- Reason for Decision: p-value < alpha判断の理由:p値 < α
- Conclusion: At the 5% level of significance, there is sufficient evidence to conclude that the mean difference in work times on days when eating breakfast and on days when not eating breakfast has increased.結論:有意水準5%では、朝食を食べた日と食べなかった日の労働時間の平均差が増加したと結論づける十分な証拠がある。
Pooled Proportion
プールした比率
estimate of the common value of p1 and p2.
p1とp2の共通の値の推定値。