第3章確率
3.5 Tree and Venn Diagrams3.5 樹形図とベン図
Sometimes, when the probability problems are complex, it can be helpful to graph the situation. Tree diagrams and Venn diagrams are two tools that can be used to visualize and solve conditional probabilities.
英語のヒント
確率の問題が複雑な場合は、状況を図にすると役立つことがある。樹形図とベン図は、条件付き確率を視覚化して求めるために使える二つの道具である。
Tree Diagrams樹形図
A tree diagram is a special type of graph used to determine the outcomes of an experiment. It consists of "branches" that are labeled with either frequencies or probabilities. Tree diagrams can make some probability problems easier to visualize and solve. The following example illustrates how to use a tree diagram.
英語のヒント
樹形図とは、実験の結果を求めるための特殊なグラフである。度数または確率のラベルが付いた「枝」からなる。樹形図を使うと、確率の問題によっては、状況を視覚化して解くことが容易になる。次の例で、樹形図の使い方を示す。
Example 3.24例題 3.24
In an urn, there are 11 balls. Three balls are red (R) and eight balls are blue (B). Draw two balls, one at a time, with replacement. "With replacement" means that you put the first ball back in the urn before you select the second ball. The tree diagram using frequencies that show all the possible outcomes follows.
英語のヒント
壺の中に11個の球があり、3個は赤(R)、8個は青(B)である。球を元に戻しながら、1個ずつ2回取り出す。「元に戻す」とは、2個目を選ぶ前に1個目の球を壺に戻すことを意味する。起こりうるすべての結果を、度数で表した樹形図を次に示す。
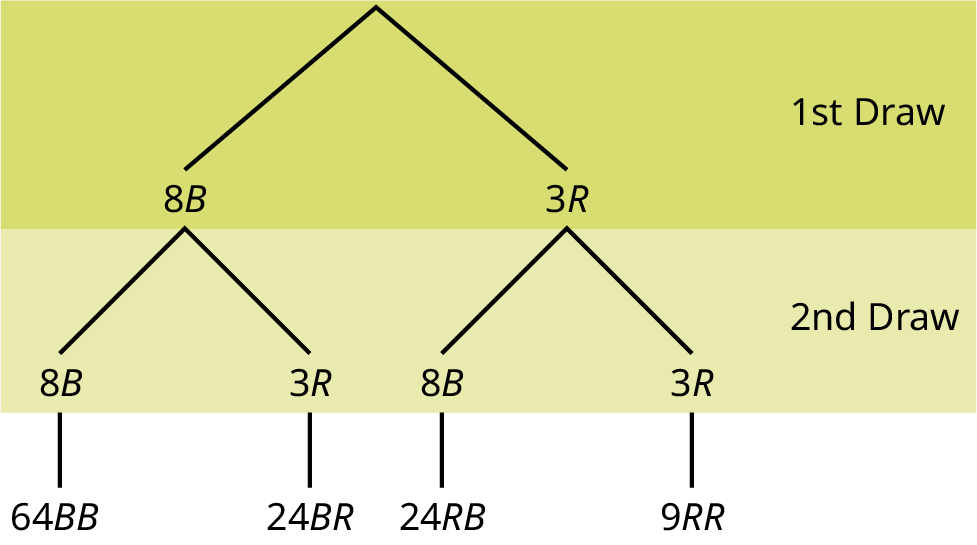
Figure 3.6図 3.6
Total = 64 + 24 + 24 + 9 = 121
合計 = 64 + 24 + 24 + 9 = 121。
The first set of branches represents the first draw. The second set of branches represents the second draw. Each of the outcomes is distinct. In fact, we can list each red ball as R1, R2, and R3 and each blue ball as B1, B2, B3, B4, B5, B6, B7, and B8. Then the nine RR outcomes can be written as:
英語のヒント
最初の枝の組は1回目の抽出、2番目の枝の組は2回目の抽出を表す。各結果は区別される。実際、赤い球をR1、R2、R3、青い球をB1、B2、B3、B4、B5、B6、B7、B8と列挙できる。このとき、RRの九つの結果は次のように書ける。
- R1R1
- R1R2
- R1R3
- R2R1
- R2R2
- R2R3
- R3R1
- R3R2
- R3R3
The other outcomes are similar.
ほかの結果も同様である。
There are a total of 11 balls in the urn. Draw two balls, one at a time, with replacement. There are 11(11) = 121 outcomes, the size of the sample space.
壺には合計11個の球がある。元に戻しながら1個ずつ2回取り出す。結果の個数は11(11) = 121であり、これが標本空間の大きさである。
a. List the 24 BR outcomes: B1R1, B1R2, B1R3, ...
a. BRの24個の結果を列挙せよ:B1R1、B1R2、B1R3、…。
b. Using the tree diagram, calculate P(RR).
b. 樹形図を使い、P(RR)を計算せよ。
c. Using the tree diagram, calculate P(RB OR BR).
c. 樹形図を使い、P(RB OR BR)を計算せよ。
d. Using the tree diagram, calculate P(R on 1st draw AND B on 2nd draw).
d. 樹形図を使い、P(1回目にR AND 2回目にB)を計算せよ。
e. Using the tree diagram, calculate P(R on 2nd draw GIVEN B on 1st draw).
e. 樹形図を使い、P(2回目にR|1回目にB)を計算せよ。
f. Using the tree diagram, calculate P(BB).
f. 樹形図を使い、P(BB)を計算せよ。
g. Using the tree diagram, calculate P(B on the 2nd draw given R on the first draw).
g. 樹形図を使い、P(2回目にB|1回目にR)を計算せよ。
Solution解き方
a.
- B1R1
- B1R2
- B1R3
- B2R1
- B2R2
- B2R3
- B3R1
- B3R2
- B3R3
- B4R1
- B4R2
- B4R3
- B5R1
- B5R2
- B5R3
- B6R1
- B6R2
- B6R3
- B7R1
- B7R2
- B7R3
- B8R1
- B8R2
- B8R3
b. P(RR) = =
c. P(RB OR BR) = + =
d. P(R on 1st draw AND B on 2nd draw) = P(RB) = =
d. P(1回目にR AND 2回目にB) = P(RB) = =
e. P(R on 2nd draw GIVEN B on 1st draw) = P(R on 2nd|B on 1st) = =
e. P(2回目にR|1回目にB) = P(2回目R|1回目B) = =
This problem is a conditional one. The sample space has been reduced to those outcomes that already have a blue on the first draw. There are 24 + 64 = 88 possible outcomes (24 BR and 64 BB). Twenty-four of the 88 possible outcomes are BR. = .
この問題は条件付き確率の問題である。標本空間は、1回目にすでに青が出た結果に縮小されている。起こりうる結果は24 + 64 = 88個(BRが24個、BBが64個)ある。その88個のうち24個がBRである。 = 。
f. P(BB) =
g. P(B on 2nd draw|R on 1st draw) =
g. P(2回目にB|1回目にR) =
There are 9 + 24 outcomes that have R on the first draw (9 RR and 24 RB). The sample space is then 9 + 24 = 33. 24 of the 33 outcomes have B on the second draw. The probability is then .
1回目にRが出る結果は9 + 24個(RRが9個、RBが24個)ある。したがって、標本空間は9 + 24 = 33である。その33個のうち24個は2回目にBが出る。確率はとなる。
Example 3.25例題 3.25
An urn has three red marbles and eight blue marbles in it. Draw two marbles, one at a time, this time without replacement, from the urn. "Without replacement" means that you do not put the first ball back before you select the second marble. Following is a tree diagram for this situation. The branches are labeled with probabilities instead of frequencies. The numbers at the ends of the branches are calculated by multiplying the numbers on the two corresponding branches, for example, .
英語のヒント
壺の中に赤いビー玉3個と青いビー玉8個がある。今度は元に戻さず、1個ずつ2回取り出す。「元に戻さない」とは、2個目を選ぶ前に1個目の球を壺に戻さないことを意味する。次に、この状況の樹形図を示す。枝には度数の代わりに確率が書かれている。枝の先端の数は、対応する二つの枝の数を掛けて計算する。たとえば、となる。
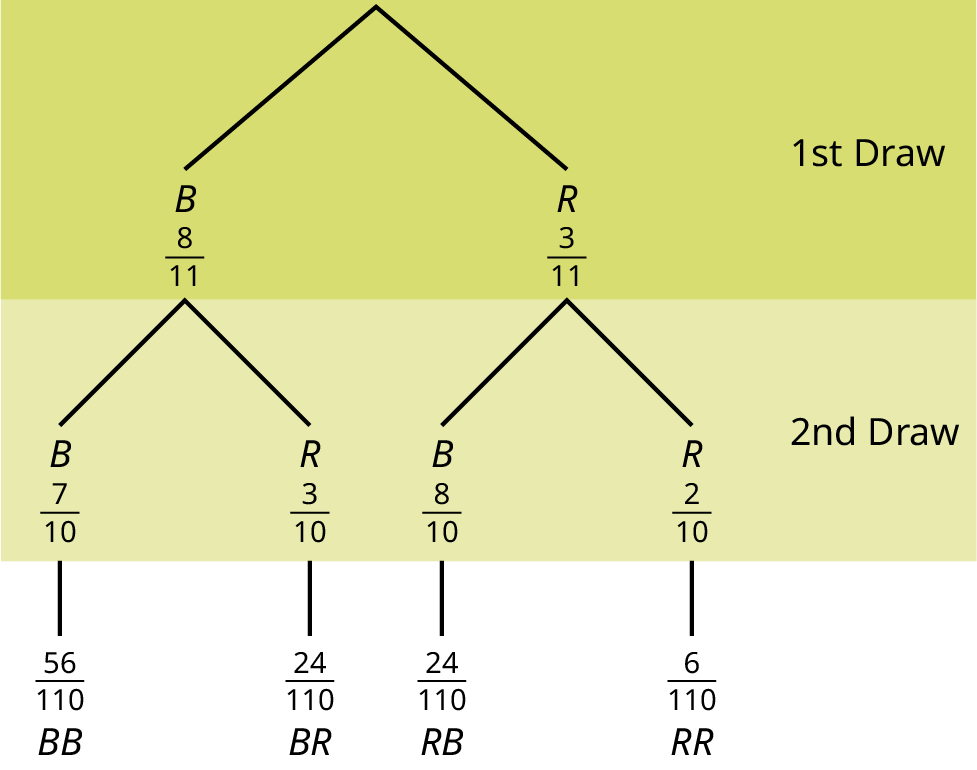
Figure 3.8図 3.8
Total =
合計 =
Calculate the following probabilities using the tree diagram.
樹形図を使い、次の確率を計算せよ。
a. P(RR) = ________
b. Fill in the blanks:
b. 空欄を埋めよ。
P(RB OR BR) =
c. P(R on 2nd|B on 1st) =
c. P(2回目にR|1回目にB) =
d. Fill in the blanks.
d. 空欄を埋めよ。
P(R on 1st AND B on 2nd) = P(RB) = (___)(___) =
P(1回目にR AND 2回目にB) = P(RB) = (___)(___) =
e. Find P(BB).
e. P(BB)を求めよ。
f. Find P(B on 2nd|R on 1st).
f. P(2回目にB|1回目にR)を求めよ。
Solution解き方
a. P(RR) =
b. P(RB OR BR) = + =
c. P(R on 2nd|B on 1st) =
c. P(2回目にR|1回目にB) =
d. P(R on 1st AND B on 2nd) = P(RB) = =
d. P(1回目にR AND 2回目にB) = P(RB) = =
e. P(BB) =
f. Using the tree diagram, P(B on 2nd|R on 1st) = P(R|B) = .
f. 樹形図を使うと、P(2回目にB|1回目にR) = P(R|B) = となる。
If we are using probabilities, we can label the tree in the following general way.
確率を使う場合は、次のような一般的な形で樹形図にラベルを付けられる。
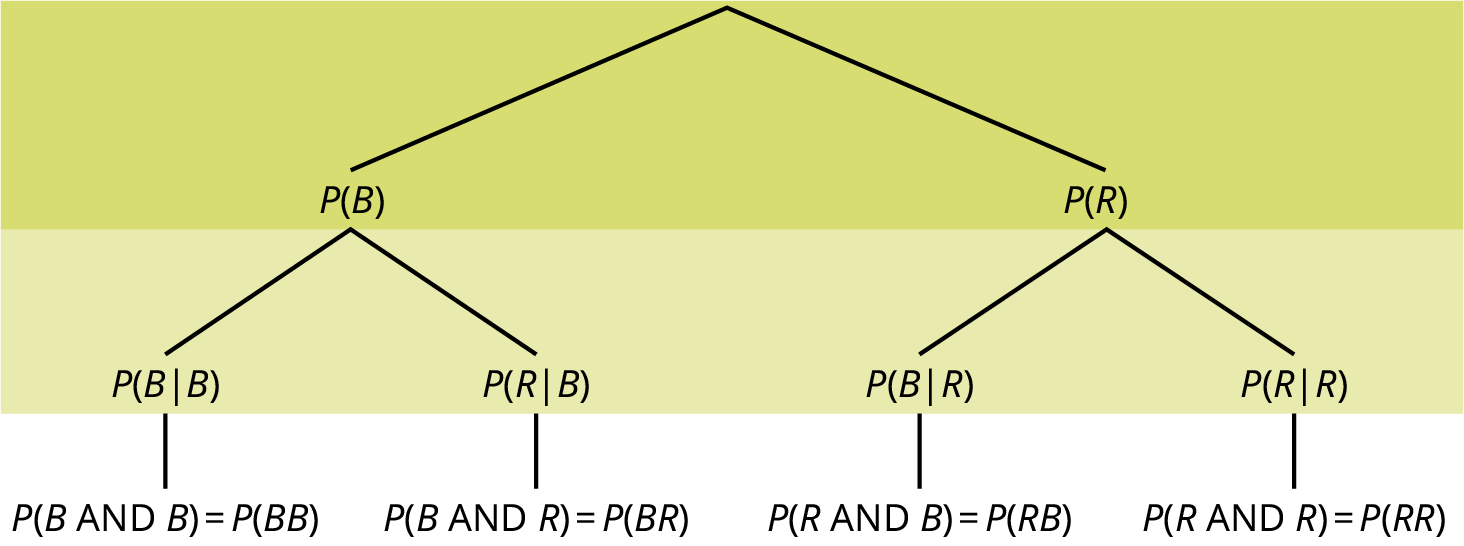
- P(R|R) here means P(R on 2nd|R on 1st)ここでP(R|R)はP(2回目にR|1回目にR)を意味する。
- P(B|R) here means P(B on 2nd|R on 1st)ここでP(B|R)はP(2回目にB|1回目にR)を意味する。
- P(R|B) here means P(R on 2nd|B on 1st)ここでP(R|B)はP(2回目にR|1回目にB)を意味する。
- P(B|B) here means P(B on 2nd|B on 1st)ここでP(B|B)はP(2回目にB|1回目にB)を意味する。
Example 3.26例題 3.26
A litter of kittens available for adoption at the Humane Society has four tabby kittens and five black kittens. A family comes in and randomly selects two kittens (without replacement) for adoption.
英語のヒント
動物愛護協会で里親を募集している一腹の子猫には、トラ猫4匹と黒猫5匹がいる。ある家族が訪れ、飼うために2匹を無作為に選ぶ(非復元抽出)。
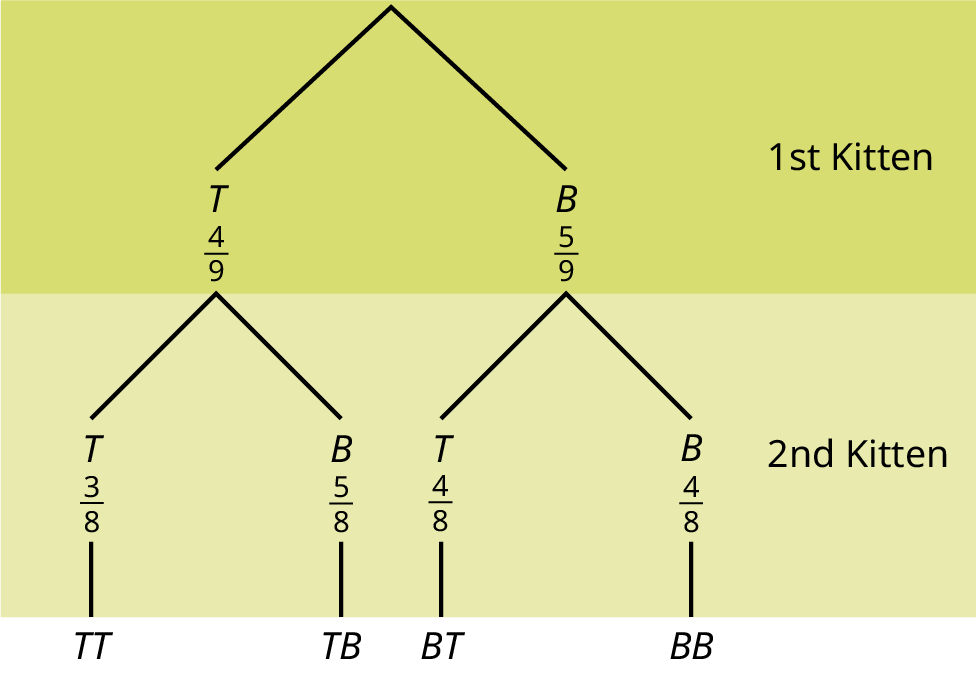


- What is the probability that both kittens are tabby?
a. b. c. d.2匹ともトラ猫である確率はいくらか。a. 、b. 、c. 、d. - What is the probability that one kitten of each coloring is selected?
a. b. c. d.それぞれの色の子猫を1匹ずつ選ぶ確率はいくらか。a. 、b. 、c. 、d. - What is the probability that a tabby is chosen as the second kitten when a black kitten was chosen as the first?1匹目に黒猫を選んだとき、2匹目にトラ猫を選ぶ確率はいくらか。
- What is the probability of choosing two kittens of the same color?同じ色の子猫を2匹選ぶ確率はいくらか。
Solution解き方
a. c, b. d, c. , d.