第3章確率
References参考文献
Data from Clara County Public H.D.
Clara郡公衆衛生局のデータ。
Data from the American Cancer Society.
米国がん協会のデータ。
Data from The Data and Story Library, 1996. Available online at http://lib.stat.cmu.edu/DASL/ (accessed May 2, 2013).
The Data and Story Libraryのデータ、1996年。オンラインで閲覧可能:http://lib.stat.cmu.edu/DASL/(2013年5月2日閲覧)。
Data from the Federal Highway Administration, part of the United States Department of Transportation.
米国運輸省の一部門である連邦道路局のデータ。
Data from the United States Census Bureau, part of the United States Department of Commerce.
米国商務省の一部門である米国国勢調査局のデータ。
Data from USA Today.
USA Todayのデータ。
“Environment.” The World Bank, 2013. Available online at http://data.worldbank.org/topic/environment (accessed May 2, 2013).
「環境」。世界銀行、2013年。オンラインで閲覧可能:http://data.worldbank.org/topic/environment(2013年5月2日閲覧)。
“Search for Datasets.” Roper Center: Public Opinion Archives, University of Connecticut., 2013. Available online at http://www.ropercenter.uconn.edu/data_access/data/search_for_datasets.html (accessed May 2, 2013).
「データセットの検索」。Roper Center: Public Opinion Archives、コネティカット大学、2013年。オンラインで閲覧可能:http://www.ropercenter.uconn.edu/data_access/data/search_for_datasets.html(2013年5月2日閲覧)。
Chapter Review章の復習
A tree diagram use branches to show the different outcomes of experiments and makes complex probability questions easy to visualize.
樹形図は、枝を使って実験の異なる結果を示し、複雑な確率の問題を視覚化しやすくする。
A Venn diagram is a picture that represents the outcomes of an experiment. It generally consists of a box that represents the sample space S together with circles or ovals. The circles or ovals represent events. A Venn diagram is especially helpful for visualizing the OR event, the AND event, and the complement of an event and for understanding conditional probabilities.
ベン図は実験の結果を表す図で、通常は標本空間Sを表す枠と、事象を表す円や楕円からなる。特にORの事象、ANDの事象、余事象の視覚化や、条件付き確率の理解に役立つ。
Exercises 117練習問題 117
Exercise 117問題 117
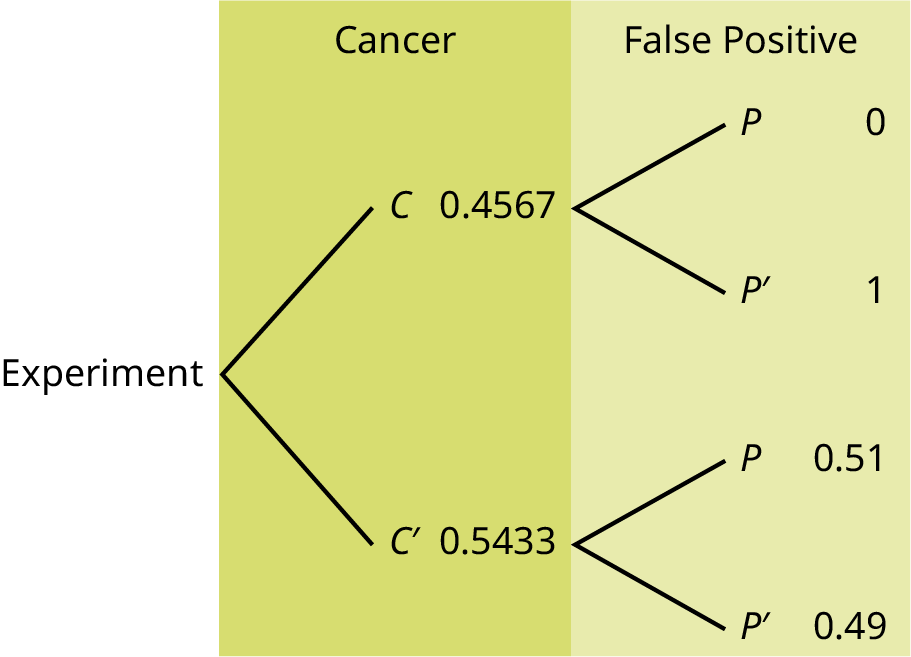
The probability that a man develops some form of cancer in his lifetime is 0.4567. The probability that a man has at least one false positive test result (meaning the test comes back for cancer when the man does not have it) is 0.51. Let: C = a man develops cancer in his lifetime; P = man has at least one false positive. Construct a tree diagram of the situation.
男性が生涯に何らかのがんを発症する確率は0.4567である。少なくとも1回、偽陽性の検査結果が出る確率は0.51である(偽陽性とは、がんでないのに検査でがんと判定されることである)。C = 男性が生涯にがんを発症する、P = 男性が少なくとも1回偽陽性となる、とする。この状況の樹形図を作れ。
Homework宿題
Exercises 118–120練習問題 118–120
Use the following information to answer the next two exercises. This tree diagram shows the tossing of an unfair coin followed by drawing one bead from a cup containing three red (R), four yellow (Y) and five blue (B) beads. For the coin, P(H) = and P(T) = where H is heads and T is tails.
次の情報を使い、続く二つの問題に答えよ。この樹形図は、偏りのある硬貨を投げた後、赤(R)3個、黄(Y)4個、青(B)5個のビーズが入ったカップから1個を取り出す実験を示す。硬貨についてP(H) = 、P(T) = であり、Hは表、Tは裏である。
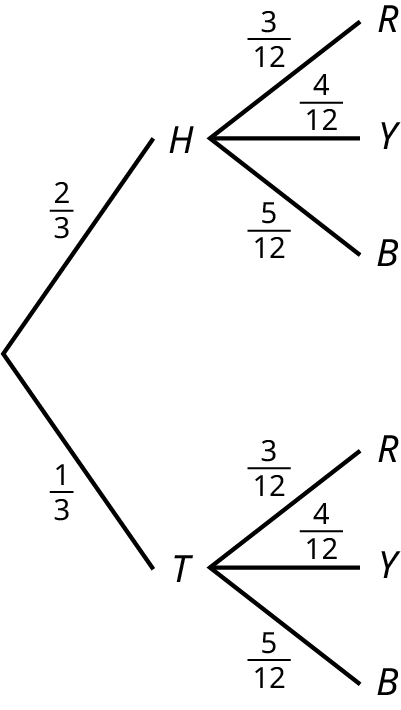
Figure 3.15図 3.15
Exercise 118問題 118
Find P(tossing a Head on the coin AND a Red bead)
P(硬貨が表 AND 赤いビーズ)を求めよ。
Exercise 119問題 119
Find P(Blue bead).
P(青いビーズ)を求めよ。
Solution解き方
a
Exercise 120問題 120
A box of cookies contains three chocolate and seven butter cookies. Miguel randomly selects a cookie and eats it. Then he randomly selects another cookie and eats it. (How many cookies did he take?)
箱にはチョコレートクッキー3枚とバタークッキー7枚が入っている。ミゲルはクッキーを1枚無作為に選んで食べる。次にもう1枚を無作為に選んで食べる。(何枚取ったか。)
- Draw the tree that represents the possibilities for the cookie selections. Write the probabilities along each branch of the tree.クッキーの選び方として起こりうる結果を表す樹形図を描け。各枝に確率を書き込め。
- Are the probabilities for the flavor of the SECOND cookie that Miguel selects independent of his first selection? Explain.ミゲルが選ぶ2枚目のクッキーの味の確率は、1枚目の選択と独立か。説明せよ。
- For each complete path through the tree, write the event it represents and find the probabilities.樹形図の各経路について、それが表す事象を書き、その確率を求めよ。
- Let S be the event that both cookies selected were the same flavor. Find P(S).Sを、選んだ2枚のクッキーの味が同じ事象とする。P(S)を求めよ。
- Let T be the event that the cookies selected were different flavors. Find P(T) by two different methods: by using the complement rule and by using the branches of the tree. Your answers should be the same with both methods.Tを、選んだクッキーの味が異なる事象とする。余事象の法則を使う方法と樹形図の枝を使う方法の二通りで、P(T)を求めよ。どちらでも同じ答えになるはずである。
- Let U be the event that the second cookie selected is a butter cookie. Find P(U).Uを、2枚目がバタークッキーである事象とする。P(U)を求めよ。
Bringing It Together総合問題
Exercises 121–122練習問題 121–122
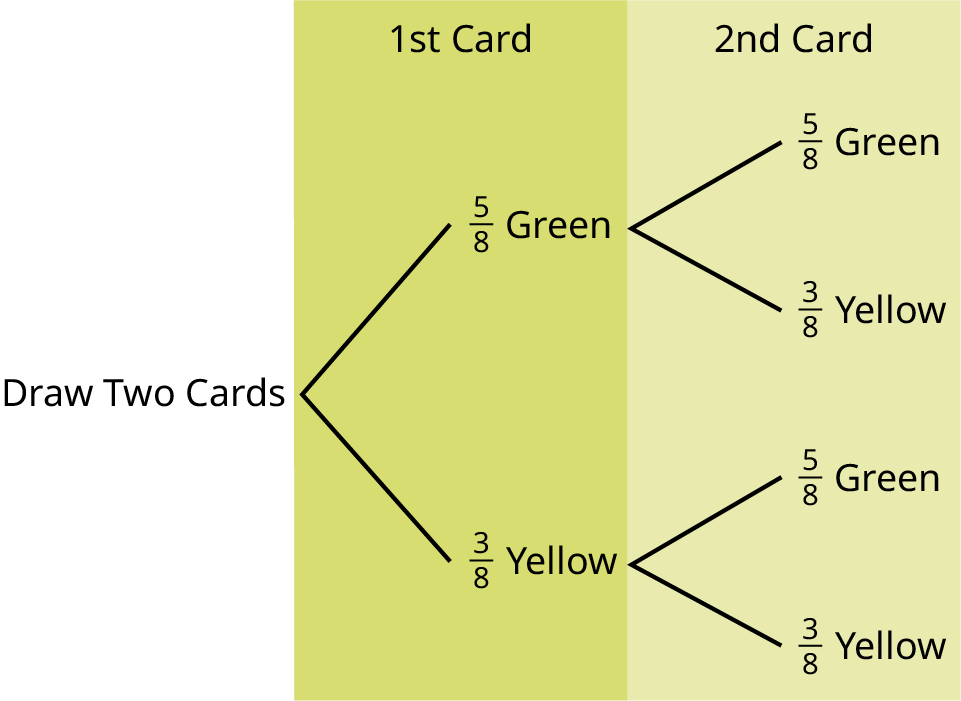
Use the following information to answer the next two exercises. Suppose that you have eight cards. Five are green and three are yellow. The cards are well shuffled.
次の情報を使い、続く二つの問題に答えよ。カードが8枚あり、5枚は緑、3枚は黄である。カードはよく混ぜてある。
Exercise 121問題 121
Suppose that you randomly draw two cards, one at a time, with replacement.
Let G1 = first card is green
Let G2 = second card is green
Let G1 = first card is green
Let G2 = second card is green
元に戻しながら1枚ずつ2回、カードを無作為に引くとする。G1 = 1枚目が緑、G2 = 2枚目が緑、とする。
- Draw a tree diagram of the situation.この状況の樹形図を描け。
- Find P(G1 AND G2).P(G1 AND G2)を求めよ。
- Find P(at least one green).P(少なくとも1枚が緑)を求めよ。
- Find P(G2|G1).P(G2|G1)を求めよ。
- Are G2 and G1 independent events? Explain why or why not.G2とG1は独立な事象か。その理由を説明せよ。
Solution解き方
- Figure 3.16図 3.16
- P(GG) = =
- P(at least one green) = P(GG) + P(GY) + P(YG) = + + =P(少なくとも1枚が緑) = P(GG) + P(GY) + P(YG) = + + =
- P(G|G) =
- Yes, they are independent because the first card is placed back in the bag before the second card is drawn; the composition of cards in the bag remains the same from draw one to draw two.
英語のヒント
はい、独立である。2枚目を引く前に1枚目を袋に戻すため、1回目と2回目で袋の中のカードの構成が同じままだからである。


Exercise 122問題 122
Suppose that you randomly draw two cards, one at a time, without replacement.
G1 = first card is green
G2 = second card is green
G1 = first card is green
G2 = second card is green
元に戻さずに1枚ずつ2回、カードを無作為に引くとする。G1 = 1枚目が緑、G2 = 2枚目が緑。
- Draw a tree diagram of the situation.この状況の樹形図を描け。
- Find P(G1 AND G2).P(G1 AND G2)を求めよ。
- Find P(at least one green).P(少なくとも1枚が緑)を求めよ。
- Find P(G2|G1).P(G2|G1)を求めよ。
- Are G2 and G1 independent events? Explain why or why not.G2とG1は独立な事象か。その理由を説明せよ。
Exercises 123–128練習問題 123–128
Use the following information to answer the next two exercises. The percent of licensed U.S. drivers (from a recent year) that are women is 48.60. Of the women, 5.03% are age 19 and under; 81.36% are age 20–64; 13.61% are age 65 or over. Of the licensed U.S. men drivers, 5.04% are age 19 and under; 81.43% are age 20–64; 13.53% are age 65 or over.
次の情報を使い、続く二つの問題に答えよ。ある最近の年の米国の運転免許保有者のうち、女性の割合は48.60%である。女性のうち5.03%は19歳以下、81.36%は20〜64歳、13.61%は65歳以上である。男性の免許保有者のうち5.04%は19歳以下、81.43%は20〜64歳、13.53%は65歳以上である。
Exercise 123問題 123
Complete the following.
次を完成させよ。
- Construct a table or a tree diagram of the situation.この状況の表または樹形図を作れ。
- Find P(driver is a woman).P(運転者が女性)を求めよ。
- Find P(driver is age 65 or over|driver is a woman).P(運転者が65歳以上|女性)を求めよ。
- Find P(driver is age 65 or over AND a woman).P(運転者が65歳以上 AND 女性)を求めよ。
- In words, explain the difference between the probabilities in part c and part d.cとdの確率の違いを言葉で説明せよ。
- Find P(driver is age 65 or over).P(運転者が65歳以上)を求めよ。
- Are being age 65 or over and being a woman mutually exclusive events? How do you know?65歳以上である事象と女性である事象は排反か。どのように判断できるか。
Solution解き方
- <2020–64>64Totals合計Women女性0.02440.39540.06610.486Men男性0.02590.41860.06950.514Totals合計0.05030.81400.13561Table 3.24表 3.24
- P(F) = 0.486
- P(>64|F) = 0.1361
- P(>64 and F) = P(F) P(>64|F) = (0.486)(0.1361) = 0.0661P(>64 and F) = P(F)P(>64|F) = (0.486)(0.1361) = 0.0661。
- P(>64|F) is the percentage of women drivers who are 65 or older and P(>64 and F) is the percentage of drivers who are women and 65 or older.P(>64|F)は女性運転者のうち65歳以上の人の割合であり、P(>64 and F)は全運転者のうち女性で65歳以上の人の割合である。
- P(>64) = P(>64 and F) + P(>64 and M) = 0.1356P(>64) = P(>64 and F) + P(>64 and M) = 0.1356。
- No, being a woman and 65 or older are not mutually exclusive because they can occur at the same time P(>64 and F) = 0.0661.いいえ。女性であり65歳以上であることは同時に起こりうるので、これらは排反ではない。P(>64 and F) = 0.0661である。
Exercise 124問題 124
Suppose that 10,000 U.S. licensed drivers are randomly selected.
米国の運転免許保有者10,000人を無作為に選ぶとする。
- How many would you expect to be men?男性は何人になると予想されるか。
- Using the table or tree diagram, construct a contingency table of gender versus age group.表または樹形図を使い、ジェンダーと年齢層の分割表を作れ。
- Using the contingency table, find the probability that out of the age 20–64 group, a randomly selected driver is a woman.分割表を使い、20〜64歳の集団から無作為に選んだ運転者が女性である確率を求めよ。
Exercise 125問題 125
Approximately 86.5% of Americans commute to work by car, truck, or van. Out of that group, 84.6% drive alone and 15.4% drive in a carpool. Approximately 3.9% walk to work and approximately 5.3% take public transportation.
英語のヒント
米国人の約86.5%は、自動車、トラック、バンで通勤する。その集団のうち84.6%は1人で運転し、15.4%は相乗りしている。約3.9%は徒歩で、約5.3%は公共交通機関で通勤する。
- Construct a table or a tree diagram of the situation. Include a branch for all other modes of transportation to work.この状況の表または樹形図を作れ。その他すべての通勤手段の枝も含めること。
- Assuming that the walkers walk alone, what percent of all commuters travel alone to work?徒歩の人は1人で歩くと仮定すると、通勤者全体の何パーセントが1人で通勤するか。
- Suppose that 1,000 workers are randomly selected. How many would you expect to travel alone to work?労働者1,000人を無作為に選ぶとする。何人が1人で通勤すると予想されるか。
- Suppose that 1,000 workers are randomly selected. How many would you expect to drive in a carpool?労働者1,000人を無作為に選ぶとする。何人が相乗りで通勤すると予想されるか。
Solution解き方
- Car, Truck or Van自動車、トラック、バンWalk徒歩Public Transportation公共交通機関Otherその他Totals合計Alone1人0.7318Not Alone1人ではない0.1332Totals合計0.86500.03900.05300.04301Table 3.25表 3.25
- If we assume that all walkers are alone and that none from the other two groups travel alone (which is a big assumption) we have: P(Alone) = 0.7318 + 0.0390 = 0.7708.徒歩の人は全員1人で、その他の二つの集団では誰も1人で通勤しないと仮定すると(これは大きな仮定である)、P(1人) = 0.7318 + 0.0390 = 0.7708となる。
- Make the same assumptions as in (b) we have: (0.7708)(1,000) = 771bと同じ仮定をすると、(0.7708)(1,000) = 771となる。
- (0.1332)(1,000) = 133
Exercise 126問題 126
When the Euro coin was introduced in 2002, two math professors had their statistics students test whether the Belgian one Euro coin was a fair coin. They spun the coin rather than tossing it and found that out of 250 spins, 140 showed a head (event H) while 110 showed a tail (event T). On that basis, they claimed that it is not a fair coin.
英語のヒント
2002年にユーロ硬貨が導入されたとき、数学教授2人が統計学の学生に、ベルギーの1ユーロ硬貨は公平かどうか調べさせた。硬貨を投げる代わりに回転させたところ、250回のうち140回は表(事象H)、110回は裏(事象T)が出た。それに基づいて、教授たちはこの硬貨は公平ではないと主張した。
- Based on the given data, find P(H) and P(T).与えられたデータに基づき、P(H)とP(T)を求めよ。
- Use a tree to find the probabilities of each possible outcome for the experiment of tossing the coin twice.硬貨を2回投げる実験について、樹形図を使い、起こりうる各結果の確率を求めよ。
- Use the tree to find the probability of obtaining exactly one head in two tosses of the coin.樹形図を使い、硬貨を2回投げてちょうど1回表が出る確率を求めよ。
- Use the tree to find the probability of obtaining at least one head.樹形図を使い、少なくとも1回表が出る確率を求めよ。
Exercise 127問題 127
Use the following information to answer the next two exercises. The following data represent the number of new vehicles purchased over a monthly time period in a certain county, within two age groups: people in their twenties and people in their thirties.
次の情報を使い、続く二つの問題に答えよ。次のデータは、ある郡で1か月間に購入された新車の台数を、20代と30代という二つの年齢層について示している。
Sedan セダン |
SUV |
Minivan ミニバン |
Other その他 |
Totals 合計 |
|
|---|---|---|---|---|---|
Twenties 20代 |
1,135 |
290 |
583 |
158 |
|
Thirties 30代 |
1,246 |
463 |
241 |
190 |
|
Totals 合計 |
Suppose a person from this county is randomly selected.
この郡から1人を無作為に選ぶとする。
- Find P(Person is in their twenties).P(その人が20代)を求めよ。
- Find P(Person purchases minivan).P(その人がミニバンを購入)を求めよ。
- Find P(Person is in their twenties OR purchases an SUV).P(その人が20代 OR SUVを購入)を求めよ。
- Find P(Person is in their twenties AND purchases a SEDAN).P(その人が20代 AND セダンを購入)を求めよ。
- Find P(Person is in their thirties AND purchases an SUV).P(その人が30代 AND SUVを購入)を求めよ。
- Find P(Person is in their twenties GIVEN person purchases a minivan).P(その人が20代|ミニバンを購入)を求めよ。
Solution解き方
The completed contingency table is as follows:
完成した分割表は次のとおりである。
Sedan セダン |
SUV |
Minivan ミニバン |
Other その他 |
Totals 合計 |
|
|---|---|---|---|---|---|
Twenties 20代 |
1,135 |
290 |
583 |
158 |
2166 |
Thirties 30代 |
1246 |
463 |
241 |
190 |
2140 |
Totals 合計 |
2381 |
753 |
824 |
348 |
4306 |
Suppose a person from this county is randomly selected.
この郡から1人を無作為に選ぶとする。
- P(Person is in their twenties) = 0.5030P(その人が20代) = 0.5030。
- P(Person purchases minivan) = 0.1914P(その人がミニバンを購入) = 0.1914。
- P(Person is in their twenties OR has purchases an SUV) = 0.6105P(その人が20代 OR SUVを購入) = 0.6105。
- P(Person is in their twenties AND purchases a SEDAN) = 0.0673P(その人が20代 AND セダンを購入) = 0.0673。
- P(Person is in their thirties AND has purchases an SUV) = 0.1075P(その人が30代 AND SUVを購入) = 0.1075。
- P(Person is in their twenties GIVEN person purchases a minivan) = 0.7075P(その人が20代|ミニバンを購入) = 0.7075。
Exercise 128問題 128
Answer these questions using probability rules. Do NOT use the contingency table. A total of 6,481 new vehicles were purchased over a monthly time period in a certain county. These purchases will be our population. Of these purchases, 36% were made by people in their twenties, and 42% were purchases of sedans. 20% of purchases were for sedans purchased by people in their twenties.
確率の法則を使って次の問いに答えよ。分割表は使わないこと。ある郡で1か月間に合計6,481台の新車が購入された。これらの購入を母集団とする。購入の36%は20代の人によるもので、42%はセダンの購入だった。全購入の20%は、20代の人によるセダンの購入だった。
- Find P(Person is in their twenties).P(その人が20代)を求めよ。
- Find P(Person purchased a sedan).P(その人がセダンを購入した)を求めよ。
- Find P(Person is in their twenties GIVEN person purchased a sedan)P(その人が20代|セダンを購入した)を求めよ。
Solution解き方
- P(Person is in their twenties) = 0.36.P(その人が20代) = 0.36。
- P(Person purchased a sedan) = 0.42P(その人がセダンを購入した) = 0.42。
- P(Person is in their twenties a woman GIVEN person purchased a sedan) = 0.4762P(その人が20代の女性|セダンを購入した) = 0.4762。
Tree Diagram
樹形図
the useful visual representation of a sample space and events in the form of a “tree” with branches marked by possible outcomes together with associated probabilities (frequencies, relative frequencies)
標本空間と事象を「木」の形で示す便利な視覚表現。枝には、起こりうる結果と、それに対応する確率(度数、相対度数)を記す。
Venn Diagram
ベン図
the visual representation of a sample space and events in the form of circles or ovals showing their intersections
標本空間と事象を、共通部分を示す円や楕円の形で表した視覚表現。