第3章確率
Venn Diagramベン図
A Venn diagram is a picture that represents the outcomes of an experiment. It generally consists of a box that represents the sample space S together with circles or ovals. The circles or ovals represent events.
英語のヒント
ベン図は、実験の結果を表す図である。通常、標本空間Sを表す枠と、円または楕円からなる。円や楕円は事象を表す。
Example 3.27例題 3.27
Suppose an experiment has the outcomes 1, 2, 3, ... , 12 where each outcome has an equal chance of occurring. Let event A = {1, 2, 3, 4, 5, 6} and event B = {6, 7, 8, 9}. Then A AND B = {6} and A OR B = {1, 2, 3, 4, 5, 6, 7, 8, 9}. The Venn diagram is as follows:
実験の結果が1、2、3、…、12で、各結果の起こる可能性が等しいとする。事象A = {1, 2, 3, 4, 5, 6}、事象B = {6, 7, 8, 9}とする。このときA AND B = {6}、A OR B = {1, 2, 3, 4, 5, 6, 7, 8, 9}となる。ベン図は次のとおりである。
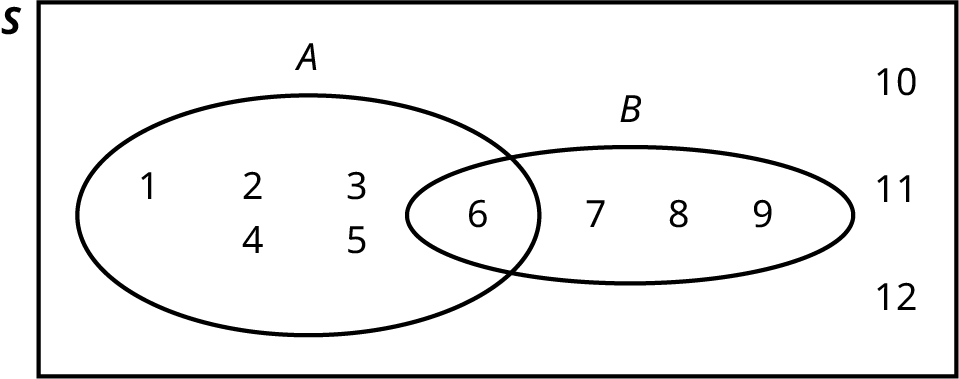
Figure 3.10図 3.10
Example 3.28例題 3.28
Flip two fair coins. Let A = tails on the first coin. Let B = tails on the second coin. Then A = {TT, TH} and B = {TT, HT}. Therefore, A AND B = {TT}. A OR B = {TH, TT, HT}.
公平な硬貨を2枚投げる。A = 1枚目が裏、B = 2枚目が裏、とする。このときA = {TT, TH}、B = {TT, HT}である。したがって、A AND B = {TT}、A OR B = {TH, TT, HT}となる。
The sample space when you flip two fair coins is X = {HH, HT, TH, TT}. The outcome HH is in NEITHER A NOR B. The Venn diagram is as follows:
公平な硬貨を2枚投げるときの標本空間はX = {HH, HT, TH, TT}である。結果HHはAにもBにも含まれない。ベン図は次のとおりである。
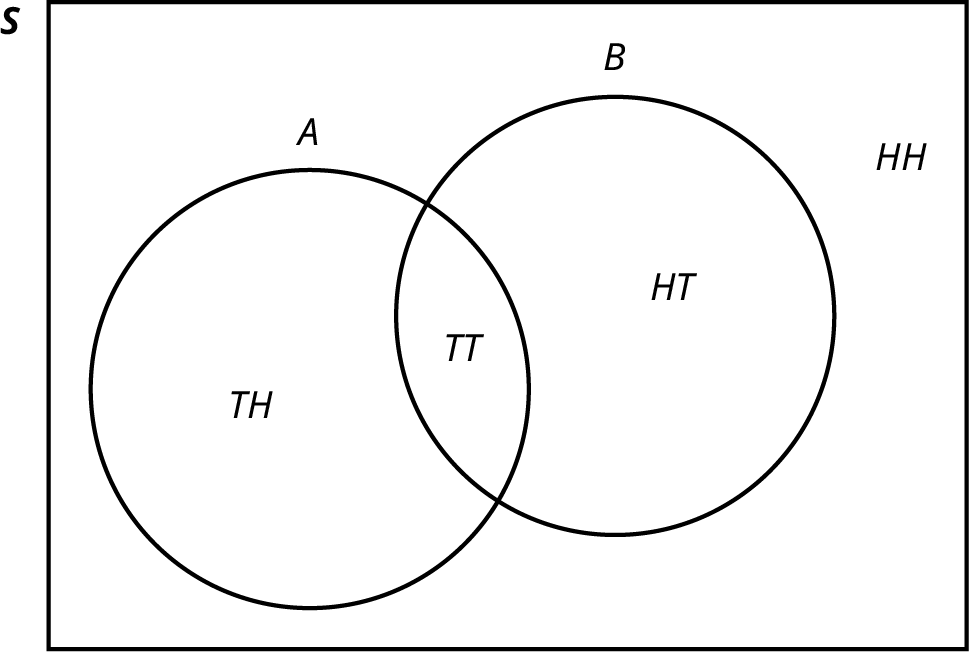
Figure 3.11図 3.11
Example 3.29例題 3.29
Forty percent of the students at a local college belong to a club and 50% work part time. Five percent of the students work part time and belong to a club. Draw a Venn diagram showing the relationships. Let C = student belongs to a club and PT = student works part time.
地元の大学の学生の40%はクラブに所属し、50%はアルバイトをしている。5%はアルバイトをし、かつクラブに所属している。この関係を示すベン図を描け。C = 学生がクラブに所属する、PT = 学生がアルバイトをする、とする。
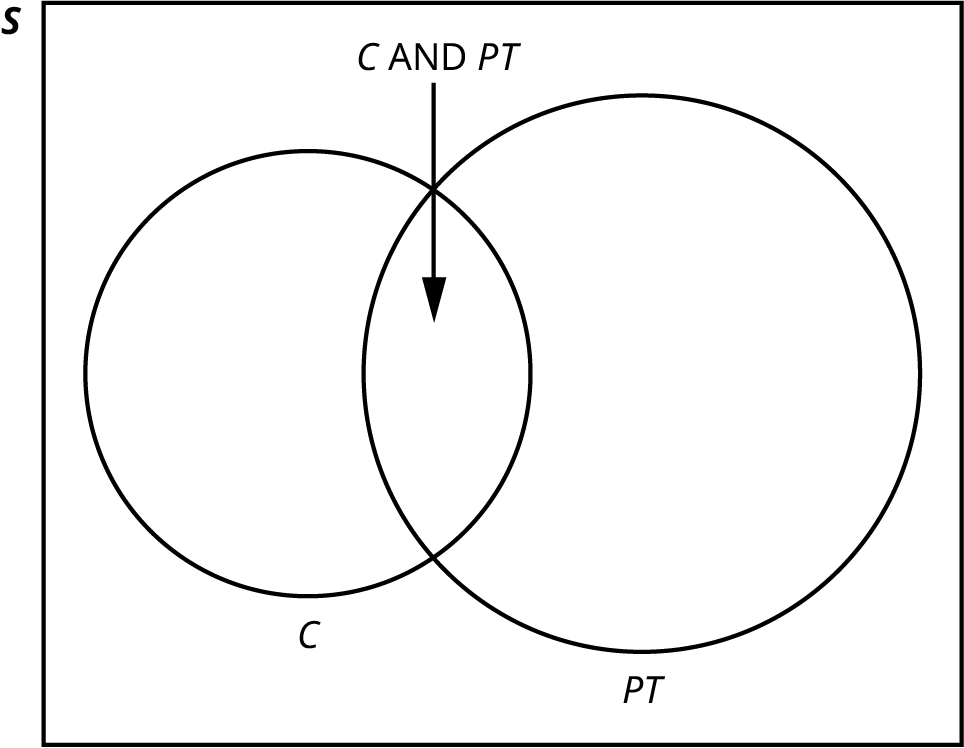
Figure 3.12図 3.12
If a student is selected at random, find
学生を1人無作為に選ぶとき、次を求めよ。
- the probability that the student belongs to a club. P(C) = 0.40その学生がクラブに所属する確率。P(C) = 0.40。
- the probability that the student works part time. P(PT) = 0.50その学生がアルバイトをする確率。P(PT) = 0.50。
- the probability that the student belongs to a club AND works part time. P(C AND PT) = 0.05その学生がクラブに所属し、かつアルバイトをする確率。P(C AND PT) = 0.05。
- the probability that the student belongs to a club given that the student works part time.その学生がアルバイトをするという条件のもとで、クラブに所属する確率。
- the probability that the student belongs to a club OR works part time. P(C OR PT) = P(C) + P(PT) - P(C AND PT) = 0.40 + 0.50 - 0.05 = 0.85その学生がクラブに所属する、またはアルバイトをする確率。P(C OR PT) = P(C) + P(PT) − P(C AND PT) = 0.40 + 0.50 − 0.05 = 0.85。
Example 3.30例題 3.30
A person with type O blood and a negative Rh factor (Rh-) can donate blood to any person with any blood type. Four percent of African Americans have type O blood and a negative RH factor, 5−10% of African Americans have the Rh- factor, and 51% have type O blood.
O型でRh因子が陰性(Rh−)の人は、どの血液型の人にも献血できる。アフリカ系米国人の4%はO型かつRh陰性であり、5〜10%はRh陰性、51%はO型である。
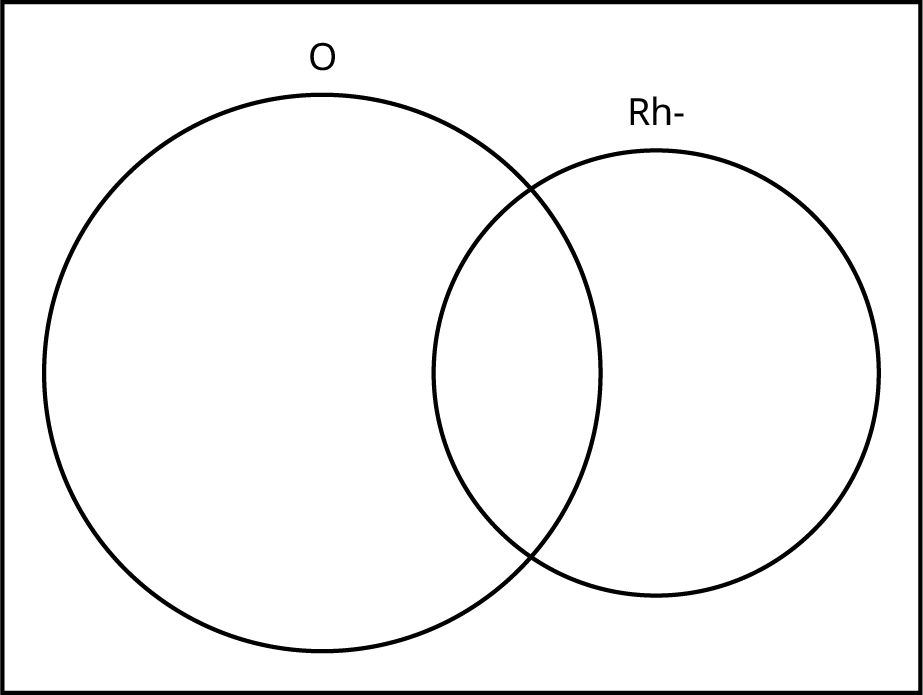


Figure 3.13図 3.13
The “O” circle represents the African Americans with type O blood. The “Rh-“ oval represents the African Americans with the Rh- factor.
「O」の円は、O型のアフリカ系米国人を表す。「Rh−」の楕円は、Rh陰性のアフリカ系米国人を表す。
We will take the average of 5% and 10% and use 7.5% as the percent of African Americans who have the Rh- factor. Let O = African American with Type O blood and R = African American with Rh- factor.
5%と10%の平均を取り、Rh陰性のアフリカ系米国人の割合として7.5%を使う。O = O型のアフリカ系米国人、R = Rh陰性のアフリカ系米国人、とする。
- P(O) = ___________
- P(R) = ___________
- P(O AND R) = ___________
- P(O OR R) = ____________
- In the Venn Diagram, describe the overlapping area using a complete sentence.ベン図の重なっている領域を、完全な文で説明せよ。
- In the Venn Diagram, describe the area in the rectangle but outside both the circle and the oval using a complete sentence.ベン図の長方形の内部で、円と楕円の両方の外にある領域を、完全な文で説明せよ。
Solution解き方
a. 0.51; b. 0.075; c. 0.04; d. 0.545; e. The area represents the African Americans that have type O blood and the Rh- factor. f. The area represents the African Americans that have neither type O blood nor the Rh- factor.
a. 0.51、b. 0.075、c. 0.04、d. 0.545。e. その領域は、O型かつRh陰性のアフリカ系米国人を表す。f. その領域は、O型でもRh陰性でもないアフリカ系米国人を表す。