第11章グラフ
11.1 Use the Rectangular Coordinate System11.1 直交座標を使う
Learning Objectives学習目標
Learning Objectives学習目標
By the end of this section, you will be able to:
この節を終えると、次のことができるようになる。
- Plot points on a rectangular coordinate system直交座標平面に点を取る
- Identify points on a graphグラフ上の点を読み取る
- Verify solutions to an equation in two variables2変数の方程式の解を確かめる
- Complete a table of solutions to a linear equation一次方程式の解の表を完成させる
- Find solutions to linear equations in two variables2変数の一次方程式の解を求める
Before You Begin (3)準備問題(3題)
Plot Points on a Rectangular Coordinate System直交座標平面に点を取る
Many maps, such as the Campus Map shown in Figure 11.2, use a grid system to identify locations. Do you see the numbers and across the top and bottom of the map and the letters A, B, C, and D along the sides? Every location on the map can be identified by a number and a letter.
英語のヒント
図11.2のキャンパス地図のように、多くの地図は格子を使って場所を示す。地図の上下に数字とが、左右にA、B、C、Dという文字があるのが分かるだろうか。地図上のどの場所も、数字と文字の組で特定できる。
For example, the Student Center is in section 2B. It is located in the grid section above the number and next to the letter B. In which grid section is the Stadium? The Stadium is in section 4D.
たとえば、学生センターは2Bの区画にある。数字の上で、文字Bの横にある区画である。競技場はどの区画にあるだろうか。競技場は4Dにある。
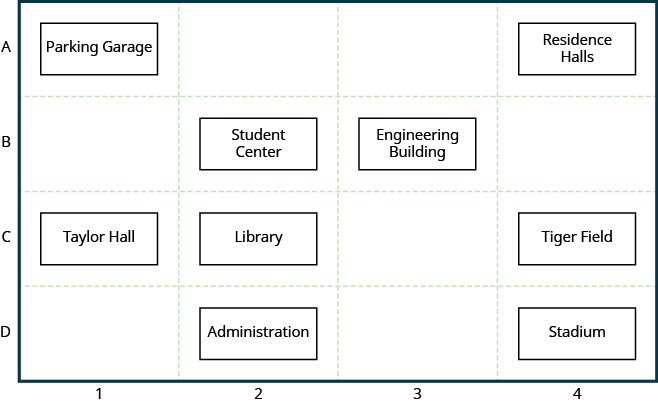
Figure 11.2図 11.2
Example 11.1例題 11.1
Use the map in Figure 11.2.
図11.2の地図を使う。
- ⓐ Find the grid section of the Residence Halls.ⓐ 学生寮がある区画を求める。
- ⓑ What is located in grid section 4C?ⓑ 4Cの区画には何があるか。
Solution解答
- ⓐ Read the number below the Residence Halls, and the letter to the side, A. So the Residence Halls are in grid section 4A.ⓐ 学生寮の下の数字と、横の文字Aを読む。したがって、学生寮は4Aの区画にある。
- ⓑ Find across the bottom of the map and C along the side. Look below the and next to the C. Tiger Field is in grid section 4C.ⓑ 地図の下側でを、横側でCを探す。の下でCの横を見る。4Cの区画にはタイガー運動場がある。
Try It (2)確認問題(2題)
Just as maps use a grid system to identify locations, a grid system is used in algebra to show a relationship between two variables in a rectangular coordinate system. To create a rectangular coordinate system, start with a horizontal number line. Show both positive and negative numbers as you did before, using a convenient scale unit. This horizontal number line is called the x-axis.
英語のヒント
地図が格子を使って場所を示すように、代数でも格子を用いた直交座標によって、2つの変数の関係を示す。直交座標を作るには、まず水平な数直線から始める。これまでと同じように、都合のよい目盛りの間隔を使って、正の数と負の数を示す。この水平な数直線をx軸という。

Now, make a vertical number line passing through the at Put the positive numbers above and the negative numbers below See Figure 11.3. This vertical line is called the y-axis.
次に、上のを通る縦の数直線を作る。より上に正の数、より下に負の数を書く。図11.3を見よう。この縦の数直線をy軸という。
Vertical grid lines pass through the integers marked on the Horizontal grid lines pass through the integers marked on the The resulting grid is the rectangular coordinate system.
縦の格子線はに記された整数を通り、横の格子線はに記された整数を通る。こうしてできる格子が、直交座標平面である。
The rectangular coordinate system is also called the plane, the coordinate plane, or the Cartesian coordinate system (since it was developed by a mathematician named René Descartes.)
直交座標平面は、平面、座標平面、またはデカルト座標とも呼ばれる。数学者ルネ・デカルトによって考案されたためである。
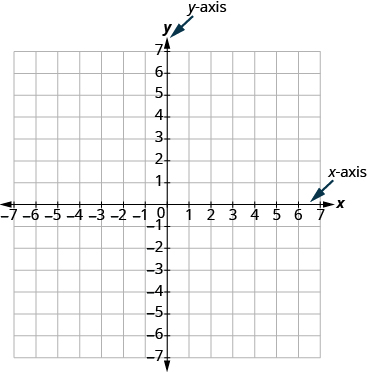
Figure 11.3図 11.3
The rectangular coordinate system.
直交座標平面。
The and the form the rectangular coordinate system. These axes divide a plane into four areas, called quadrants. The quadrants are identified by Roman numerals, beginning on the upper right and proceeding counterclockwise. See Figure 11.4.
英語のヒント
とが直交座標を作る。この2本の軸は、平面を象限と呼ばれる4つの領域に分ける。象限は右上から始め、反時計回りにローマ数字で区別する。図11.4を見よう。
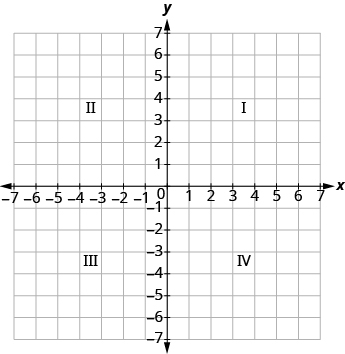
Figure 11.4図 11.4
The four quadrants of the rectangular coordinate system
直交座標平面の4つの象限。
In the rectangular coordinate system, every point is represented by an ordered pair. The first number in the ordered pair is the x-coordinate of the point, and the second number is the y-coordinate of the point.
英語のヒント
直交座標では、どの点も順序対によって表される。順序対の最初の数はその点のx座標、2つ目の数はy座標である。
So how do the coordinates of a point help you locate a point on the plane?
では、点の座標から、平面上の位置はどのように分かるのだろうか。
Let’s try locating the point . In this ordered pair, the -coordinate is and the -coordinate is .
点の位置を探してみよう。この順序対では、座標が、座標がである。
We start by locating the value, on the Then we lightly sketch a vertical line through as shown in Figure 11.5.
英語のヒント
まず、上での値を探す。次に、図11.5のように、を通る縦の線を薄く描く。
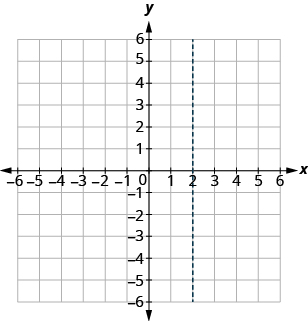
Figure 11.5図 11.5
Now we locate the value, on the -axis and sketch a horizontal line through . The point where these two lines meet is the point with coordinates We plot the point there, as shown in Figure 11.6.
英語のヒント
次に、軸上での値を探し、を通る横の線を描く。2本の線が交わる点が、座標の点である。図11.6のように、そこに点を取る。
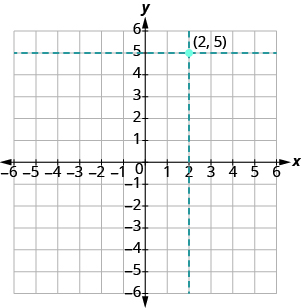
Figure 11.6図 11.6
Example 11.2例題 11.2
Plot and in the same rectangular coordinate system.
同じ直交座標平面に、とを取る。
Solution解答
The coordinate values are the same for both points, but the and values are reversed. Let’s begin with point The is so find on the and sketch a vertical line through The is so we find on the and sketch a horizontal line through Where the two lines meet, we plot the point
2つの点で使われている数は同じだが、との値が逆になっている。まず点から始めよう。はなので、上のを探し、を通る縦の線を薄く描く。はなので、上のを探し、を通る横の線を描く。2本の線が交わるところに、点を取る。
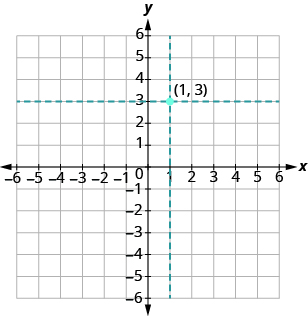
To plot the point we start by locating on the and sketch a vertical line through Then we find on the and sketch a horizontal line through Where the two lines meet, we plot the point
点を取るには、まず上のを探し、を通る縦の線を描く。次に、上のを探し、を通る横の線を描く。2本の線が交わるところに、点を取る。
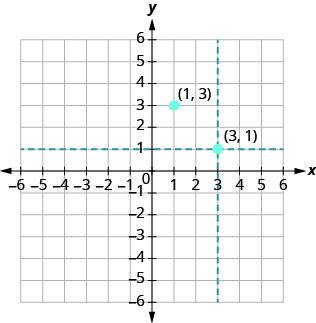
Notice that the order of the coordinates does matter, so, is not the same point as
英語のヒント
座標の順序は重要である。したがって、とは同じ点ではない。
Try It (2)確認問題(2題)
Example 11.3例題 11.3
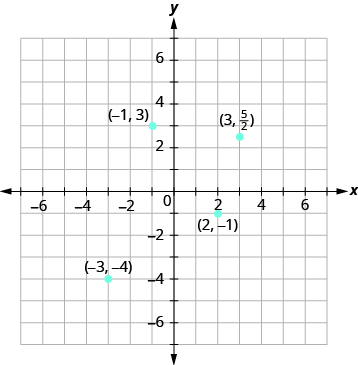
Plot each point in the rectangular coordinate system and identify the quadrant in which the point is located:
それぞれの点を直交座標平面に取り、その点がどの象限にあるかを答える。
- ⓐ
- ⓑ
- ⓒ
- ⓓ
Solution解答
The first number of the coordinate pair is the and the second number is the
座標を表す組の最初の数が、2つ目の数がである。
ⓐ Since the point is in Quadrant II.
ⓐ なので、点は第2象限にある。
ⓑ Since the point is in Quadrant III.
ⓑ なので、点は第3象限にある。
ⓒ Since the point is in Quadrant lV.
ⓒ なので、点は第4象限にある。
ⓓ Since the point is in Quadrant I. It may be helpful to write as the mixed number, or decimal, Then we know that the point is halfway between and on the
ⓓ なので、点は第1象限にある。を帯分数、または小数で表すと分かりやすい。そうすると、その点の高さは上のとのちょうど中間だと分かる。
Try It (2)確認問題(2題)
How do the signs affect the location of the points?
符号は点の位置にどのように影響するだろうか。
Example 11.4例題 11.4
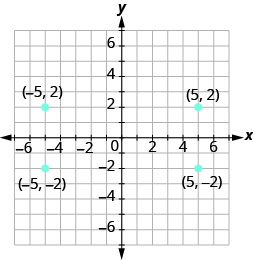
Plot each point:
それぞれの点を取る。
- ⓐ
- ⓑ
- ⓒ
- ⓓ
Solution解答
As we locate the and the we must be careful with the signs.
とを探すときは、符号に注意しなければならない。
Try It (2)確認問題(2題)
You may have noticed some patterns as you graphed the points in the two previous examples.
前の2つの例で点を取ったとき、いくつかの規則に気付いたかもしれない。
For each point in Quadrant IV, what do you notice about the signs of the coordinates?
第4象限の各点の座標の符号について、何が分かるだろうか。
What about the signs of the coordinates of the points in the third quadrant? The second quadrant? The first quadrant?
第3象限の点の座標の符号はどうだろうか。第2象限はどうか。第1象限はどうか。
Can you tell just by looking at the coordinates in which quadrant the point (−2, 5) is located? In which quadrant is (2, −5) located?
英語のヒント
座標を見るだけで、点(−2, 5)がどの象限にあるか分かるだろうか。(2, −5)はどの象限にあるだろうか。
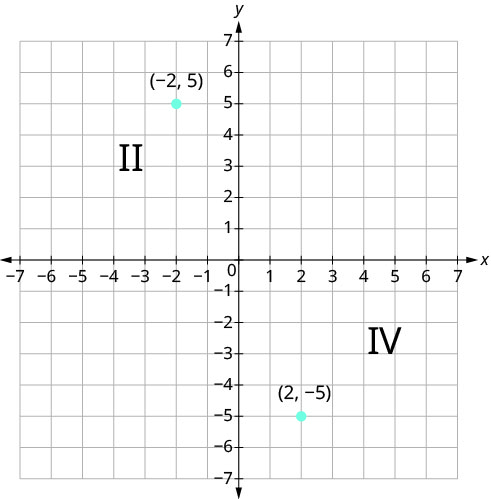
We can summarize sign patterns of the quadrants as follows. Also see Figure 11.7.
各象限の符号の組み合わせは、次のようにまとめられる。図11.7も見よう。
Quadrant I 第1象限 |
Quadrant II 第2象限 |
Quadrant III 第3象限 |
Quadrant IV 第4象限 |
|---|---|---|---|
(x,y) |
(x,y) |
(x,y) |
(x,y) |
(+,+) |
(−,+) |
(−,−) |
(+,−) |
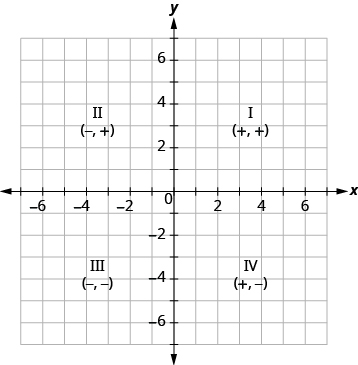
Figure 11.7図 11.7
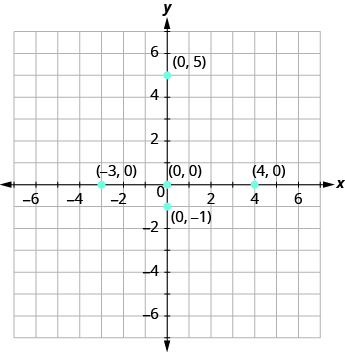
What if one coordinate is zero? Where is the point located? Where is the point located? The point is on the y-axis and the point is on the x-axis.
片方の座標が0ならどうなるだろうか。点はどこにあるか。点はどこにあるか。点はy軸上、点はx軸上にある。
Example 11.5例題 11.5
Plot each point on a coordinate grid:
座標平面にそれぞれの点を取る。
- ⓐ
- ⓑ
- ⓒ
- ⓓ
- ⓔ
Solution解答
- ⓐ Since the point whose coordinates are is on theⓐ なので、座標がの点は上にある。
- ⓑ Since the point whose coordinates are is on theⓑ なので、座標がの点は上にある。
- ⓒ Since the point whose coordinates are is on theⓒ なので、座標がの点は上にある。
- ⓓ Since and the point whose coordinates are is the origin.ⓓ かつなので、座標がの点は原点である。
- ⓔ Since the point whose coordinates are is on theⓔ なので、座標がの点は上にある。