第11章グラフ
Graph a Line Using the Intercepts切片を使って直線を描く
To graph a linear equation by plotting points, you can use the intercepts as two of your three points. Find the two intercepts, and then a third point to ensure accuracy, and draw the line. This method is often the quickest way to graph a line.
英語のヒント
点を取って一次方程式のグラフを描くとき、3点のうち2点として切片を使える。2つの切片を求め、正確さを確かめるために3つ目の点を求めてから、直線を描く。この方法は、直線を最も速く描ける方法であることが多い。
Example 11.26例題 11.26
Graph using intercepts.
切片を使ってのグラフを描く。
Solution解答
First, find the Let
まずを求める。とする。
The is
はである。
Now find the Let
次にを求める。とする。
The is
はである。
Find a third point. We’ll use
3つ目の点を求める。を使う。
A third solution to the equation is
方程式の3つ目の解はである。
Summarize the three points in a table and then plot them on a graph.
3点を表にまとめてから、グラフ上に取る。
x |
y |
(x,y) |
|---|---|---|
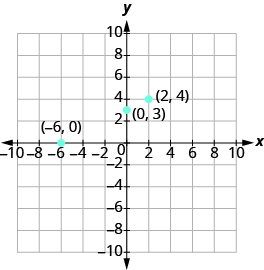
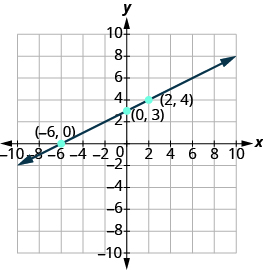
Do the points line up? Yes, so draw line through the points.
点は一直線に並ぶか。並ぶので、点を通る直線を描く。
Try It (2)確認問題(2題)
Example 11.27例題 11.27
Graph using intercepts.
切片を使ってのグラフを描く。
Solution解答
Find the intercepts and a third point.
切片と3つ目の点を求める。
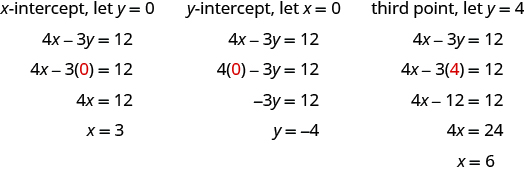
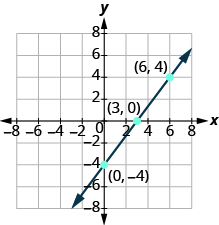
We list the points and show the graph.
点を表にまとめ、グラフを示す。
Try It (2)確認問題(2題)
Example 11.28例題 11.28
Graph using the intercepts.
切片を使ってのグラフを描く。
Solution解答
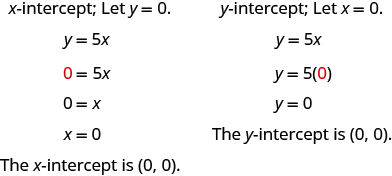
This line has only one intercept! It is the point
この直線の切片は1点しかない。点である。
To ensure accuracy, we need to plot three points. Since the intercepts are the same point, we need two more points to graph the line. As always, we can choose any values for so we’ll let be and
正確さを確かめるためには、3点を取る必要がある。2つの切片が同じ点なので、直線を描くにはさらに2点が必要になる。いつもどおりには好きな値を選べるので、をとにする。
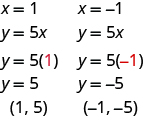
Organize the points in a table.
点を表にまとめる。
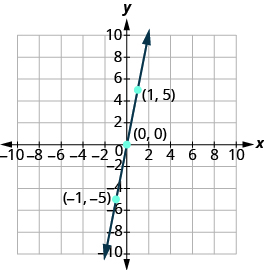
Plot the three points, check that they line up, and draw the line.
3点を取り、一直線に並ぶことを確かめてから、直線を描く。
Try It (2)確認問題(2題)
Choose the Most Convenient Method to Graph a Line直線を描くのに最も便利な方法を選ぶ
While we could graph any linear equation by plotting points, it may not always be the most convenient method. This table shows six of equations we’ve graphed in this chapter, and the methods we used to graph them.
英語のヒント
どの一次方程式も点を取ってグラフを描けるが、いつもそれが最も便利な方法とは限らない。この表には、この章でグラフを描いた6つの方程式と、使った方法が示されている。
Equation 方程式 |
Method 方法 |
|
|---|---|---|
#1 |
Plotting points 点を取って描く |
|
#2 |
Plotting points 点を取って描く |
|
#3 |
Vertical line 垂直な直線 |
|
#4 |
Horizontal line 水平な直線 |
|
#5 |
Intercepts 切片 |
|
#6 |
Intercepts 切片 |
What is it about the form of equation that can help us choose the most convenient method to graph its line?
グラフを描くのに最も便利な方法を選ぶうえで、方程式の形のどこが役立つのだろうか。
Notice that in equations #1 and #2, y is isolated on one side of the equation, and its coefficient is 1. We found points by substituting values for x on the right side of the equation and then simplifying to get the corresponding y- values.
方程式1と2では、片方の辺にyだけがあり、係数は1である。右辺のxに値を代入して簡単にし、それに対応するyの値を求めて点を見つけた。
Equations #3 and #4 each have just one variable. Remember, in this kind of equation the value of that one variable is constant; it does not depend on the value of the other variable. Equations of this form have graphs that are vertical or horizontal lines.
方程式3と4には、それぞれ変数が1つしかない。この種類の方程式では、その変数の値は一定であり、もう片方の変数の値によらない。この形の方程式のグラフは、垂直または水平な直線になる。
In equations #5 and #6, both x and y are on the same side of the equation. These two equations are of the form . We substituted and to find the x- and y- intercepts, and then found a third point by choosing a value for x or y.
方程式5と6では、xとyが同じ辺にある。この2つの方程式はの形である。とを代入してx切片とy切片を求め、その後xまたはyの値を選んで3つ目の点を求めた。
This leads to the following strategy for choosing the most convenient method to graph a line.
ここから、直線を描くのに最も便利な方法を選ぶための、次の方針が得られる。
Example 11.29例題 11.29
Identify the most convenient method to graph each line:
それぞれの直線を描くのに最も便利な方法を選ぶ。
- ⓐ
- ⓑ
- ⓒ
- ⓓ
Solution解答
ⓐ
This equation has only one variable, Its graph is a horizontal line crossing the at
この方程式の変数はだけである。グラフは、上のを通る水平な直線になる。
ⓑ
This equation is of the form Find the intercepts and one more point.
この方程式はの形である。切片と、さらに1つの点を求める。
ⓒ
There is only one variable, The graph is a vertical line crossing the at
変数はだけである。グラフは、上のを通る垂直な直線になる。
ⓓ
Since is isolated on the left side of the equation, it will be easiest to graph this line by plotting three points.
方程式の左辺にだけがあるので、3点を取ってグラフを描くのが最も簡単である。