第11章グラフ
Find the Slope of Horizontal and Vertical Lines水平な直線と垂直な直線の傾きを求める
Do you remember what was special about horizontal and vertical lines? Their equations had just one variable.
水平な直線と垂直な直線の特別な点を覚えているだろうか。方程式に変数が1つしかなかった。
- horizontal line all the -coordinates are the same.水平な直線では、すべての座標が同じである。
- vertical line all the -coordinates are the same.垂直な直線では、すべての座標が同じである。
So how do we find the slope of the horizontal line One approach would be to graph the horizontal line, find two points on it, and count the rise and the run. Let’s see what happens in Figure 11.24. We’ll use the two points and to count the rise and run.
水平な直線の傾きは、どう求めればよいだろうか。グラフを描き、直線上の2点を選んで縦と横の変化量を数える方法がある。図11.24で確かめよう。2点とを使って数える。
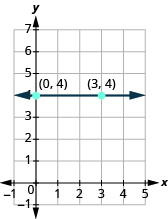
Figure 11.24図 11.24
What is the rise? 縦の変化量はいくつか。 |
The rise is 0. 縦の変化量は0である。 |
What is the run? 横の変化量はいくつか。 |
The run is 3. 横の変化量は3である。 |
What is the slope? 傾きはいくつか。 |
|
The slope of the horizontal line is
水平な直線の傾きはである。
All horizontal lines have slope . When the -coordinates are the same, the rise is .
どの水平な直線も傾きはである。座標が等しければ、縦の変化量はになる。
Now we’ll consider a vertical line, such as the line , shown in Figure 11.25. We’ll use the two points and to count the rise and run.
次に、図11.25ののような垂直な直線を考える。2点とを使って、縦と横の変化量を数える。
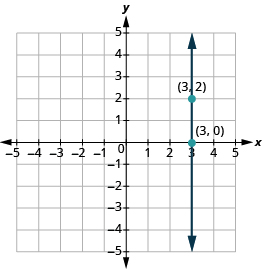
Figure 11.25図 11.25
What is the rise? 縦の変化量はいくつか。 |
The rise is 2. 縦の変化量は2である。 |
What is the run? 横の変化量はいくつか。 |
The run is 0. 横の変化量は0である。 |
What is the slope? 傾きはいくつか。 |
|
But we can’t divide by Division by is undefined. So we say that the slope of the vertical line is undefined. The slope of all vertical lines is undefined, because the run is
しかし、で割ることはできない。による割り算は定義されていないので、垂直な直線の傾きは定義されないという。垂直な直線はどれも横の変化量がなので、傾きが定義されない。
Example 11.37例題 11.37
Find the slope of each line:
各直線の傾きを求める。
- ⓐ
- ⓑ
Solution解答
ⓐ
This is a vertical line, so its slope is undefined.
これは垂直な直線なので、傾きは定義されない。
ⓑ
This is a horizontal line, so its slope is
これは水平な直線なので、傾きはである。
Try It (2)確認問題(2題)
Use the Slope Formula to find the Slope of a Line between Two Points傾きの公式を使って2点を通る直線の傾きを求める
Sometimes we need to find the slope of a line between two points and we might not have a graph to count out the rise and the run. We could plot the points on grid paper, then count out the rise and the run, but there is a way to find the slope without graphing.
2点を通る直線の傾きを求めたいとき、縦と横の変化量を数えるグラフがないこともある。方眼紙に点を取り、変化量を数えてもよいが、グラフを描かずに傾きを求める方法がある。
Before we get to it, we need to introduce some new algebraic notation. We have seen that an ordered pair gives the coordinates of a point. But when we work with slopes, we use two points. How can the same symbol be used to represent two different points?
その方法に進む前に、新しい代数の記法を紹介する必要がある。順序対が点の座標を表すことを学んだ。しかし、傾きを扱うときは2つの点を使う。同じ記号で、異なる2点をどう表せばよいだろうか。
Mathematicians use subscripts to distinguish between the points. A subscript is a small number written to the right of, and a little lower than, a variable.
英語のヒント
数学では、点を区別するために下付きの添字を使う。添字は、変数の右下に小さく書く数字である。
We will use to identify the first point and to identify the second point. If we had more than two points, we could use and so on.
最初の点を、2つ目の点をで表す。点がさらにあれば、などを使える。
To see how the rise and run relate to the coordinates of the two points, let’s take another look at the slope of the line between the points and in Figure 11.26.
縦と横の変化量が2点の座標とどう関係するかを見るため、図11.26の点とを通る直線の傾きを、もう一度考えよう。
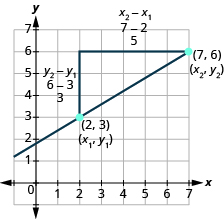
Figure 11.26図 11.26
Since we have two points, we will use subscript notation.
2つの点を使うので、添字付きの記法を用いる。
On the graph, we counted the rise of The rise can also be found by subtracting the of the points.
グラフでは、縦の変化量をと数えた。これは、2点のを引くことでも求められる。
We counted a run of The run can also be found by subtracting the
横の変化量をと数えた。これも、を引いて求められる。
We know 次が分かっている。 |
|
So したがって、 |
|
We rewrite the rise and run by putting in the coordinates. 座標を入れて、縦と横の変化量を書き直す。 |
|
But 6 is the -coordinate of the second point, and 3 is the -coordinate of the first point . So we can rewrite the rise using subscript notation. 6は2つ目の点の座標、3は1つ目の点の座標である。したがって、縦の変化量を添字付きの記法で書き直せる。 |
|
Also 7 is the -coordinate of the second point, and 2 is the -coordinate of the first point . So we rewrite the run using subscript notation. 同様に、7は2つ目の点の座標、2は1つ目の点の座標である。したがって、横の変化量を添字付きの記法で書き直す。 |
We’ve shown that is really another version of We can use this formula to find the slope of a line when we have two points on the line.
は、実際にはを別の形で表したものだと分かった。直線上の2点が分かれば、この公式で傾きを求められる。
Say the formula to yourself to help you remember it:
覚えやすいように、公式を自分で言ってみよう。
Additional Resources追加教材
Example 11.38例題 11.38
Find the slope of the line between the points and
点とを通る直線の傾きを求める。
Solution解答
We’ll call point #1 and point #2. を点1、を点2と呼ぶ。 |
|
Use the slope formula. 傾きの公式を使う。 |
|
Substitute the values in the slope formula: 傾きの公式に値を代入する。 |
|
of the second point minus of the first point 2つ目の点のから1つ目の点のを引く。 |
|
of the second point minus of the first point 2つ目の点のから1つ目の点のを引く。 |
|
Simplify the numerator and the denominator. 分子と分母を簡単にする。 |
|
Let’s confirm this by counting out the slope on the graph.
グラフ上で変化量を数え、傾きを確かめよう。
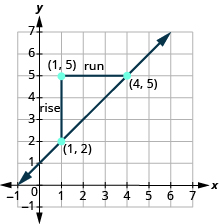
The rise is and the run is so
縦の変化量は、横の変化量はなので、次のようになる。
Try It (2)確認問題(2題)
How do we know which point to call #1 and which to call #2? Let’s find the slope again, this time switching the names of the points to see what happens. Since we will now be counting the run from right to left, it will be negative.
英語のヒント
どちらの点を1、どちらを2とすればよいのだろうか。今度は点の番号を入れ替えて傾きを求め、どうなるかを確かめよう。横の変化量を右から左へ数えるので、その値は負になる。
We’ll call point #1 and point #2. を点1、を点2と呼ぶ。 |
|
Use the slope formula. 傾きの公式を使う。 |
|
Substitute the values in the slope formula: 傾きの公式に値を代入する。 |
|
of the second point minus of the first point 2つ目の点のから1つ目の点のを引く。 |
|
of the second point minus of the first point 2つ目の点のから1つ目の点のを引く。 |
|
Simplify the numerator and the denominator. 分子と分母を簡単にする。 |
|
The slope is the same no matter which order we use the points.
点を使う順序がどちらでも、傾きは同じである。
Example 11.39例題 11.39
Find the slope of the line through the points and
点とを通る直線の傾きを求める。
Solution解答
We’ll call point #1 and point #2. を点1、を点2と呼ぶ。 |
|
Use the slope formula. 傾きの公式を使う。 |
|
Substitute the values 値を代入する。 |
|
of the second point minus of the first point 2つ目の点のから1つ目の点のを引く。 |
|
of the second point minus of the first point 2つ目の点のから1つ目の点のを引く。 |
|
Simplify. 簡単にする。 |
|
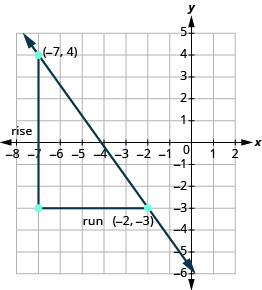
Let’s confirm this on the graph shown.
図のグラフで確かめよう。