第11章グラフ
11.2 Graphing Linear Equations11.2 一次方程式のグラフを描く
Learning Objectives学習目標
Learning Objectives学習目標
By the end of this section, you will be able to:
この節を終えると、次のことができるようになる。
- Recognize the relation between the solutions of an equation and its graph方程式の解とグラフの関係を理解する
- Graph a linear equation by plotting points点を取って一次方程式のグラフを描く
- Graph vertical and horizontal lines垂直な直線と水平な直線を描く
Before You Begin (3)準備問題(3題)
Recognize the Relation Between the Solutions of an Equation and its Graph方程式の解とグラフの関係を理解する
In Use the Rectangular Coordinate System, we found a few solutions to the equation . They are listed in the table below. So, the ordered pairs , , , , are some solutions to the equation. We can plot these solutions in the rectangular coordinate system as shown on the graph at right.
「直交座標を使う」では、方程式の解をいくつか求めた。それらを下の表に示す。順序対、、、は、方程式の解の一部である。右のグラフのように、これらの解を直交座標平面に取ることができる。
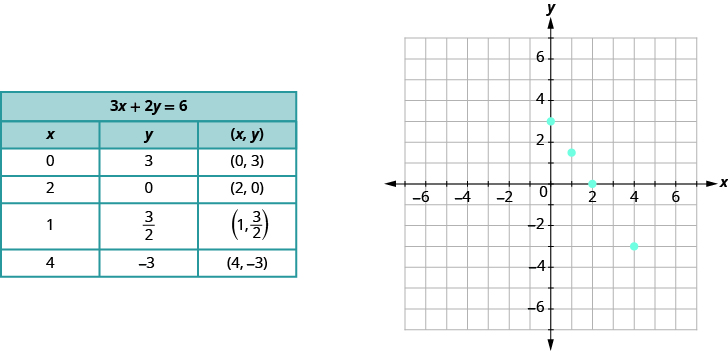
Notice how the points line up perfectly? We connect the points with a straight line to get the graph of the equation . Notice the arrows on the ends of each side of the line. These arrows indicate the line continues.
点がぴったり一直線に並んでいることに気付いただろうか。これらを直線で結ぶと、方程式のグラフになる。直線の両端の矢印は、直線がその先も続くことを示す。
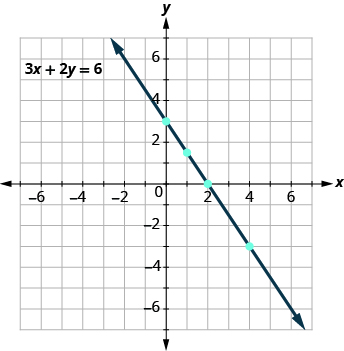
Every point on the line is a solution of the equation. Also, every solution of this equation is a point on this line. Points not on the line are not solutions!
直線上のどの点も方程式の解であり、この方程式のどの解も直線上の点である。直線上にない点は解ではない。
Notice that the point whose coordinates are is on the line shown in Figure 11.8. If you substitute and into the equation, you find that it is a solution to the equation.
座標がの点は、図11.8の直線上にある。とを方程式に代入すると、方程式の解であることが分かる。
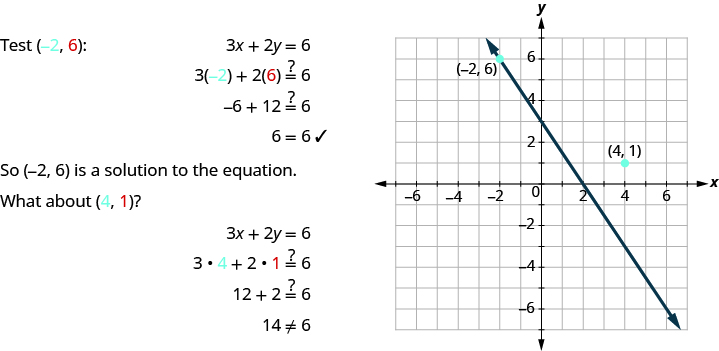
Figure 11.8図 11.8
So is not a solution to the equation . Therefore the point is not on the line.
したがって、は方程式の解ではない。そのため、点は直線上にない。
This is an example of the saying,” A picture is worth a thousand words.” The line shows you all the solutions to the equation. Every point on the line is a solution of the equation. And, every solution of this equation is on this line. This line is called the graph of the equation .
英語のヒント
これは「1枚の絵は千の言葉に値する」ということわざの例である。直線は方程式のすべての解を示す。直線上のどの点も解であり、どの解もこの直線上にある。この直線を、方程式のグラフという。
Example 11.15例題 11.15
The graph of is shown below.
のグラフを下に示す。
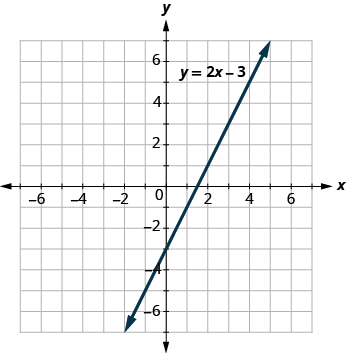
For each ordered pair decide
各順序対について、次を判定する。
- ⓐ Is the ordered pair a solution to the equation?ⓐ この順序対は方程式の解か。
- ⓑ Is the point on the line?ⓑ この点は直線上にあるか。
- (a)
- (b)
- (c)
- (d)
Solution解き方
Substitute the - and -values into the equation to check if the ordered pair is a solution to the equation.
との値を方程式に代入し、その順序対が方程式の解かどうか確かめる。
ⓐ

ⓑ Plot the points A: B: C: and D: .
The points , , and are on the line , and the point is not on the line.
The points , , and are on the line , and the point is not on the line.
ⓑ A:、B:、C:、D:の点を取る。点、、は直線上にあるが、点は直線上にない。
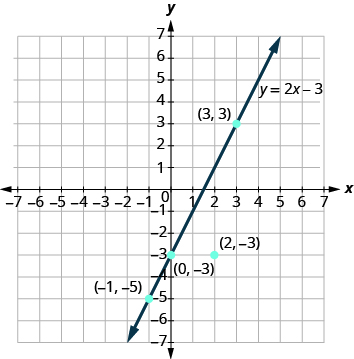
The points which are solutions to are on the line, but the point which is not a solution is not on the line.
の解となる点は直線上にあるが、解でない点は直線上にない。
Try It (1)確認問題(1題)
Graph a Linear Equation by Plotting Points点を取って一次方程式のグラフを描く
There are several methods that can be used to graph a linear equation. The method we used at the start of this section to graph is called plotting points, or the Point-Plotting Method.
英語のヒント
一次方程式のグラフを描く方法はいくつかある。この節の初めに使った方法は、点を取る方法、または点をプロットする方法と呼ばれる。
Let’s graph the equation by plotting points.
点を取って、方程式のグラフを描こう。
We start by finding three points that are solutions to the equation. We can choose any value for or and then solve for the other variable.
まず、方程式の解となる点を3つ求める。またはに好きな値を選び、もう片方の変数について解けばよい。
Since is isolated on the left side of the equation, it is easier to choose values for We will use and for for this example. We substitute each value of into the equation and solve for
英語のヒント
方程式の左辺にだけがあるので、の値を選ぶ方が簡単である。この例では、の値としてとを使う。それぞれのの値を方程式に代入し、について解く。
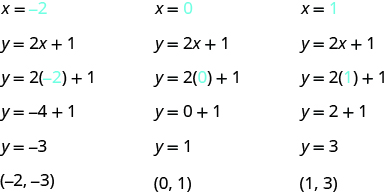
We can organize the solutions in a table. See Table 11.2.
解は表にまとめられる。表11.2を見よう。
Now we plot the points on a rectangular coordinate system. Check that the points line up. If they did not line up, it would mean we made a mistake and should double-check all our work. See Figure 11.9.
英語のヒント
次に、直交座標平面に点を取る。点が一直線に並ぶか確かめよう。並ばなければ、どこかを間違えたことになるので、計算と作図をすべて見直す必要がある。図11.9を見よう。
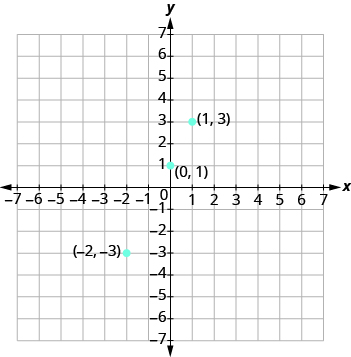
Figure 11.9図 11.9
Draw the line through the three points. Extend the line to fill the grid and put arrows on both ends of the line. The line is the graph of
3つの点を通る直線を描く。座標平面の端まで延ばし、両端に矢印を付ける。この直線がのグラフである。
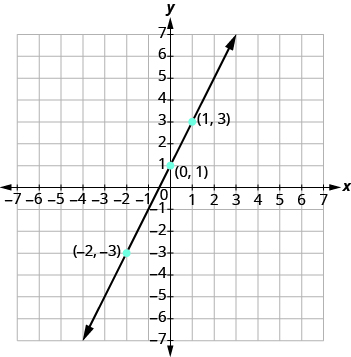
Figure 11.10図 11.10
It is true that it only takes two points to determine a line, but it is a good habit to use three points. If you plot only two points and one of them is incorrect, you can still draw a line but it will not represent the solutions to the equation. It will be the wrong line. If you use three points, and one is incorrect, the points will not line up. This tells you something is wrong and you need to check your work. See Figure 11.11.
英語のヒント
確かに直線は2点だけで決まるが、3点を使う習慣を付けるとよい。2点だけを取り、片方を間違えた場合も、直線は描けてしまう。しかし、それは方程式の解を表す直線ではなく、間違った直線になる。3点を使い、1点を間違えた場合は、点が一直線に並ばない。これによって、どこかに間違いがあり、確認が必要だと分かる。図11.11を見よう。
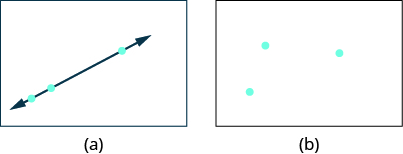
Figure 11.11図 11.11
Look at the difference between (a) and (b). All three points in (a) line up so we can draw one line through them. The three points in (b) do not line up. We cannot draw a single straight line through all three points.
(a)と(b)の違いを見よう。(a)の3点は一直線に並ぶので、3点を通る1本の直線を描ける。(b)の3点は一直線に並ばず、すべてを通る1本の直線は描けない。
Example 11.16例題 11.16
Graph the equation
方程式のグラフを描く。
Solution解答
Find three points that are solutions to the equation. It’s easier to choose values for and solve for Do you see why?
方程式の解となる点を3つ求める。の値を選んでについて解く方が簡単である。理由が分かるだろうか。
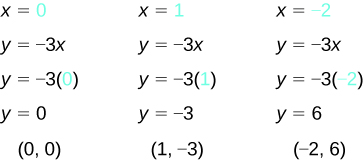
List the points in a table.
点を表にまとめる。
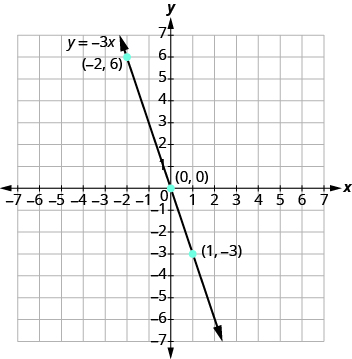
Plot the points, check that they line up, and draw the line as shown.
点を取り、一直線に並ぶことを確かめて、図のように直線を描く。
Try It (2)確認問題(2題)
When an equation includes a fraction as the coefficient of we can substitute any numbers for But the math is easier if we make ‘good’ choices for the values of This way we will avoid fraction answers, which are hard to graph precisely.
英語のヒント
方程式のの係数が分数の場合も、にはどの数でも代入できる。しかし、の値を「うまく」選ぶと計算が簡単になる。そうすれば、正確に点を取りにくい分数の答えを避けられる。
Example 11.17例題 11.17
Graph the equation
方程式のグラフを描く。
Solution解答
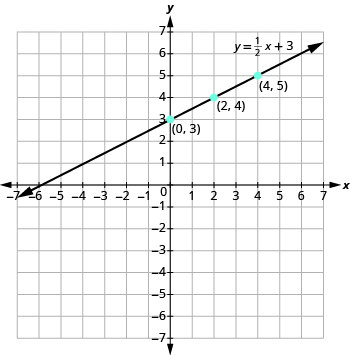
Find three points that are solutions to the equation. Since this equation has the fraction as a coefficient of we will choose values of carefully. We will use zero as one choice and multiples of for the other choices.
方程式の解となる点を3つ求める。この方程式ではの係数が分数なので、の値を注意して選ぶ。1つは0にし、ほかはの倍数にする。
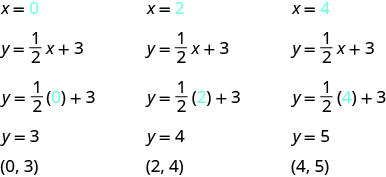
The points are shown in the table.
点を表に示す。
Plot the points, check that they line up, and draw the line as shown.
点を取り、一直線に並ぶことを確かめて、図のように直線を描く。
Try It (2)確認問題(2題)
So far, all the equations we graphed had given in terms of Now we’ll graph an equation with and on the same side.
英語のヒント
これまでにグラフを描いた方程式では、がを使って表されていた。今度は、とが同じ辺にある方程式のグラフを描く。
Example 11.18例題 11.18
Graph the equation
方程式のグラフを描く。
Solution解答
Find three points that are solutions to the equation. Remember, you can start with any value of or
方程式の解となる点を3つ求める。とのどちらについても、好きな値から始めてよい。
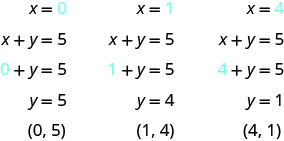
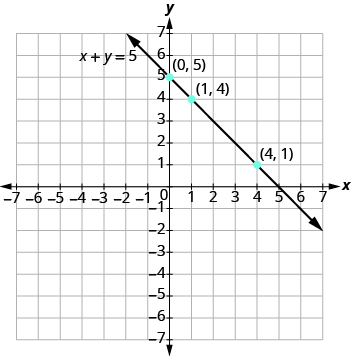
We list the points in a table.
点を表にまとめる。
Then plot the points, check that they line up, and draw the line.
次に点を取り、一直線に並ぶことを確かめてから、直線を描く。
Try It (2)確認問題(2題)
In the previous example, the three points we found were easy to graph. But this is not always the case. Let’s see what happens in the equation If is what is the value of
前の例で求めた3点は、描きやすい点だった。しかし、いつもそうとは限らない。方程式ではどうなるかを見よう。がのとき、の値はいくつか。
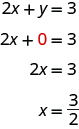
The solution is the point This point has a fraction for the -coordinate. While we could graph this point, it is hard to be precise graphing fractions. Remember in the example we carefully chose values for so as not to graph fractions at all. If we solve the equation for it will be easier to find three solutions to the equation.
英語のヒント
解は点である。この点の座標は分数になっている。点を取ることはできるが、分数の位置を正確に描くのは難しい。の例では、分数の点を描かずに済むよう、の値を注意して選んだ。方程式をについて解けば、3つの解を見つけやすくなる。
Now we can choose values for that will give coordinates that are integers. The solutions for and are shown.
これで、座標が整数になるようにの値を選べる。とに対する解を示す。
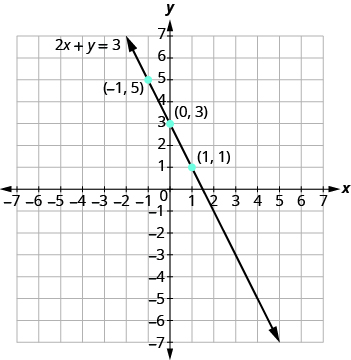
Example 11.19例題 11.19
Graph the equation
方程式のグラフを描く。
Solution解答
Find three points that are solutions to the equation.
方程式の解となる点を3つ求める。
First, solve the equation for
まず、方程式をについて解く。
We’ll let be and to find three points. The ordered pairs are shown in the table. Plot the points, check that they line up, and draw the line.
の値をとにして、3つの点を求める。順序対は表のとおりである。点を取り、一直線に並ぶことを確かめてから直線を描く。
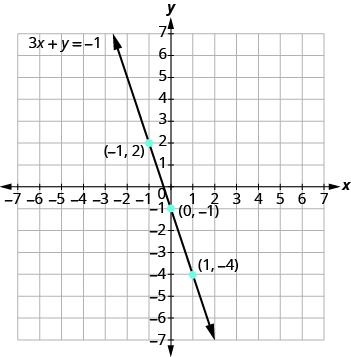
If you can choose any three points to graph a line, how will you know if your graph matches the one shown in the answers in the book? If the points where the graphs cross the and -axes are the same, the graphs match.
直線を描くための3点を自由に選べるなら、自分のグラフが本の解答と一致していることを、どう確かめればよいだろうか。グラフと軸・軸との交点が同じなら、グラフは一致する。