第11章グラフ
11.4 Understand Slope of a Line11.4 直線の傾きを理解する
Before You Begin (3)準備問題(3題)
As we’ve been graphing linear equations, we’ve seen that some lines slant up as they go from left to right and some lines slant down. Some lines are very steep and some lines are flatter. What determines whether a line slants up or down, and if its slant is steep or flat?
一次方程式のグラフを描く中で、左から右へ進むと上がる直線と、下がる直線があることを見てきた。とても急な直線もあれば、より平らな直線もある。上がるか下がるか、急か緩やかかは、何によって決まるのだろうか。
The steepness of the slant of a line is called the slope of the line. The concept of slope has many applications in the real world. The pitch of a roof and the grade of a highway or wheelchair ramp are just some examples in which you literally see slopes. And when you ride a bicycle, you feel the slope as you pump uphill or coast downhill.
英語のヒント
直線がどれくらい急かを表すものを、直線の傾きという。傾きの概念は、現実の世界で広く応用される。屋根の勾配や、道路・車椅子用スロープの勾配は、文字どおり傾きが目に見える例である。自転車では、坂道をこいで上ったり、こがずに下ったりするときに傾きを感じる。
Use Geoboards to Model Slopeジオボードを使って傾きを表す
In this section, we will explore the concepts of slope.
この節では、傾きの概念を調べる。
Using rubber bands on a geoboard gives a concrete way to model lines on a coordinate grid. By stretching a rubber band between two pegs on a geoboard, we can discover how to find the slope of a line.
英語のヒント
ジオボードに輪ゴムを掛けると、座標平面の直線を具体的に表せる。2本のピンの間に輪ゴムを張ることで、直線の傾きを求める方法を見つけられる。
Additional Resources追加教材
We’ll start by stretching a rubber band between two pegs to make a line as shown in Figure 11.17.
まず、図11.17のように2本のピンの間に輪ゴムを張り、直線を作る。
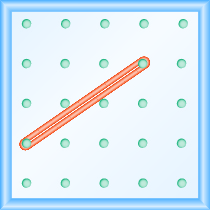
Figure 11.17図 11.17
Does it look like a line?
直線のように見えるだろうか。
Now we stretch one part of the rubber band straight up from the left peg and around a third peg to make the sides of a right triangle as shown in Figure 11.18. We carefully make a angle around the third peg, so that one side is vertical and the other is horizontal.
次に、輪ゴムの片側を左のピンから真上へ伸ばし、3本目のピンに掛けて、図11.18のような直角三角形の辺を作る。3本目のピンのところでの角になるよう注意し、一方の辺を縦、もう一方を横にする。
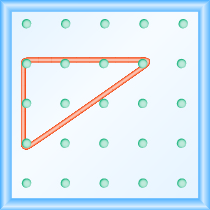
Figure 11.18図 11.18
To find the slope of the line, we measure the distance along the vertical and horizontal legs of the triangle. The vertical distance is called the rise and the horizontal distance is called the run, as shown in Figure 11.19.
英語のヒント
直線の傾きを求めるには、三角形の縦と横の直角を挟む辺に沿って、距離を測る。図11.19のように、縦の距離をrise、横の距離をrunという。
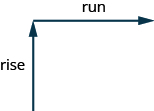
Figure 11.19図 11.19
To help remember the terms, it may help to think of the images shown in Figure 11.20.
用語を覚えるには、図11.20の絵を思い浮かべると役立つ。
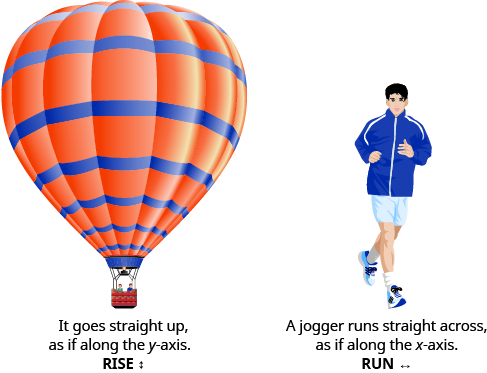
Figure 11.20図 11.20
On our geoboard, the rise is units because the rubber band goes up spaces on the vertical leg. See Figure 11.21.
このジオボードでは、輪ゴムが縦の辺で目盛り上がるので、縦の変化量は単位である。図11.21を見よう。
What is the run? Be sure to count the spaces between the pegs rather than the pegs themselves! The rubber band goes across spaces on the horizontal leg, so the run is units.
英語のヒント
横の変化量はいくつだろうか。ピンの本数ではなく、ピンとピンの間隔を数えよう。輪ゴムは横の辺で目盛り進むので、横の変化量は単位である。
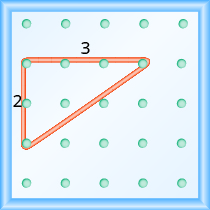
Figure 11.21図 11.21
The slope of a line is the ratio of the rise to the run. So the slope of our line is In mathematics, the slope is always represented by the letter
直線の傾きは、横の変化量に対する縦の変化量の比である。したがって、この直線の傾きはになる。数学では、傾きは常に文字で表す。
What is the slope of the line on the geoboard in Figure 11.21?
図11.21のジオボード上の直線の傾きはいくつだろうか。
When we work with geoboards, it is a good idea to get in the habit of starting at a peg on the left and connecting to a peg to the right. Then we stretch the rubber band to form a right triangle.
ジオボードを使うときは、左側のピンから始めて右側のピンへつなぐ習慣を付けるとよい。それから輪ゴムを伸ばし、直角三角形を作る。
If we start by going up the rise is positive, and if we stretch it down the rise is negative. We will count the run from left to right, just like you read this paragraph, so the run will be positive.
最初に上へ進めば縦の変化量は正、下へ伸ばせば負になる。横の変化量は、この段落を読むのと同じように左から右へ数えるので、正になる。
Since the slope formula has rise over run, it may be easier to always count out the rise first and then the run.
傾きの公式は縦の変化量を横の変化量で割る形なので、常に縦を先に、次に横を数えると分かりやすい。
Example 11.30例題 11.30
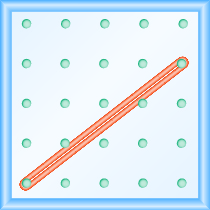
What is the slope of the line on the geoboard shown?
図のジオボード上の直線の傾きはいくつか。
Solution解答
Use the definition of slope.
傾きの定義を使う。
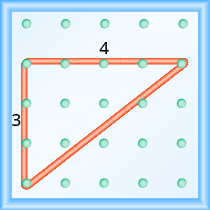
Start at the left peg and make a right triangle by stretching the rubber band up and to the right to reach the second peg.
左のピンから始め、輪ゴムを上へ、そして右へ伸ばして2本目のピンに届かせ、直角三角形を作る。
Count the rise and the run as shown.
図のように、縦と横の変化量を数える。
Try It (2)確認問題(2題)
Example 11.31例題 11.31
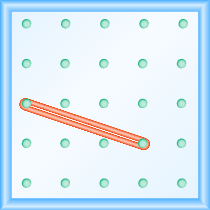
What is the slope of the line on the geoboard shown?
図のジオボード上の直線の傾きはいくつか。
Solution解答
Use the definition of slope.
傾きの定義を使う。
Start at the left peg and make a right triangle by stretching the rubber band to the peg on the right. This time we need to stretch the rubber band down to make the vertical leg, so the rise is negative.
左のピンから始め、右のピンへ輪ゴムを伸ばして直角三角形を作る。今回は縦の辺を作るために輪ゴムを下へ伸ばすので、縦の変化量は負になる。
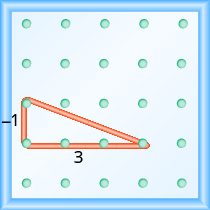
Try It (2)確認問題(2題)
Notice that in the first example, the slope is positive and in the second example the slope is negative. Do you notice any difference in the two lines shown in Figure 11.22.
最初の例では傾きが正、2つ目の例では負であることに注目しよう。図11.22の2本の直線に、どのような違いが見えるだろうか。
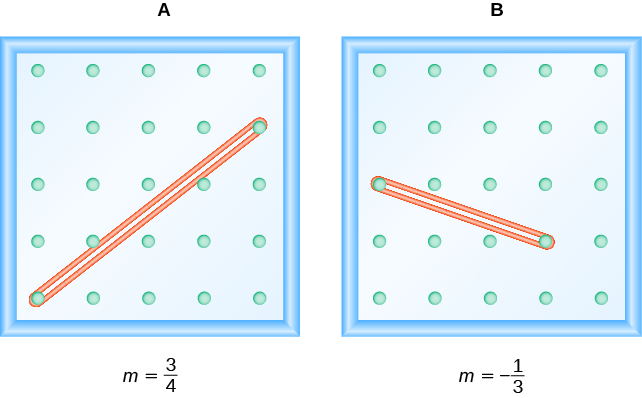
Figure 11.22図 11.22
As you read from left to right, the line in Figure A, is going up; it has positive slope. The line Figure B is going down; it has negative slope.
左から右へ読むと、図Aの直線は上がっており、傾きは正である。図Bの直線は下がっており、傾きは負である。
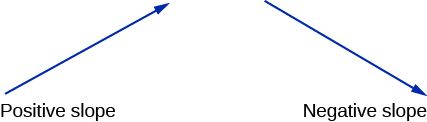
Figure 11.23図 11.23
Example 11.32例題 11.32
Use a geoboard to model a line with slope
ジオボードを使い、傾きがの直線を表す。
Solution解答
To model a line with a specific slope on a geoboard, we need to know the rise and the run.
決まった傾きの直線をジオボードに表すには、縦と横の変化量が分からなければならない。
Use the slope formula. 傾きの公式を使う。 |
|
Replace with . をに置き換える。 |
So, the rise is unit and the run is units.
したがって、縦の変化量は単位、横の変化量は単位である。
Start at a peg in the lower left of the geoboard. Stretch the rubber band up unit, and then right units.
ジオボードの左下のピンから始める。輪ゴムを上へ単位、次に右へ単位伸ばす。
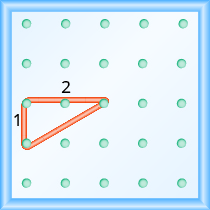
The hypotenuse of the right triangle formed by the rubber band represents a line with a slope of
英語のヒント
輪ゴムでできた直角三角形の斜辺が、傾きの直線を表す。
Try It (2)確認問題(2題)
Example 11.33例題 11.33
Use a geoboard to model a line with slope
ジオボードを使い、傾きがの直線を表す。
Solution解答
Use the slope formula. 傾きの公式を使う。 |
|
Replace with . をに置き換える。 |
So, the rise is and the run is
したがって、縦の変化量は、横の変化量はである。
Since the rise is negative, we choose a starting peg on the upper left that will give us room to count down. We stretch the rubber band down unit, then to the right units.
英語のヒント
縦の変化量が負なので、下へ数える余地のある左上のピンを出発点に選ぶ。輪ゴムを下へ単位、次に右へ単位伸ばす。
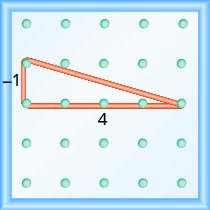
The hypotenuse of the right triangle formed by the rubber band represents a line whose slope is
輪ゴムでできた直角三角形の斜辺が、傾きの直線を表す。