第11章グラフ
Graph Vertical and Horizontal Lines垂直な直線と水平な直線を描く
Can we graph an equation with only one variable? Just and no or just without an How will we make a table of values to get the points to plot?
変数が1つしかない方程式もグラフにできるだろうか。だけでがない場合や、だけでがない場合はどうか。点を取るための値の表を、どのように作ればよいだろうか。
Let’s consider the equation The equation says that is always equal to so its value does not depend on No matter what is, the value of is always
英語のヒント
方程式を考えよう。この式では、は常にに等しく、その値はによらない。が何であっても、の値は常にである。
To make a table of solutions, we write for all the values. Then choose any values for Since does not depend on you can chose any numbers you like. But to fit the size of our coordinate graph, we’ll use and for the -coordinates as shown in the table.
解の表を作るには、の値をすべてと書く。次に、に好きな値を選ぶ。はによらないので、どの数でもよい。ただし、座標平面の大きさに収まるよう、表のように座標にはとを使う。
Then plot the points and connect them with a straight line. Notice in Figure 11.12 that the graph is a vertical line.
次に点を取り、直線で結ぶ。図11.12では、グラフが垂直な直線になっていることに注目しよう。
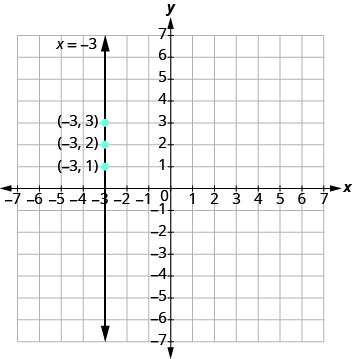
Figure 11.12図 11.12
Example 11.20例題 11.20
Graph the equation What type of line does it form?
方程式のグラフを描く。どのような直線になるか。
Solution解答
The equation has only variable, and is always equal to We make a table where is always and we put in any values for
この方程式の変数はだけで、は常にに等しい。を常にとし、には好きな値を入れた表を作る。
Plot the points and connect them as shown.
図のように点を取り、それらを結ぶ。
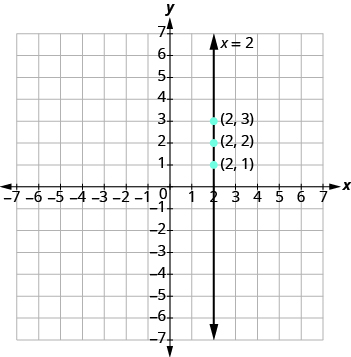
The graph is a vertical line passing through the -axis at
グラフは、軸上のを通る垂直な直線である。
Try It (2)確認問題(2題)
What if the equation has but no ? Let’s graph the equation This time the -value is a constant, so in this equation does not depend on
方程式にがあり、がない場合はどうだろうか。のグラフを描こう。今回はの値が一定であり、この方程式のはによらない。
To make a table of solutions, write for all the values and then choose any values for
解の表を作るには、の値をすべてとし、には好きな値を選ぶ。
We’ll use and for the -values.
の値には、とを使う。
Plot the points and connect them, as shown in Figure 11.13. This graph is a horizontal line passing through the at
図11.13のように点を取り、それらを結ぶ。このグラフは、上のを通る水平な直線である。
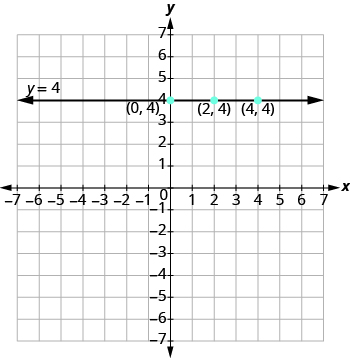
Figure 11.13図 11.13
Example 11.21例題 11.21
Graph the equation
方程式のグラフを描く。
Solution解答
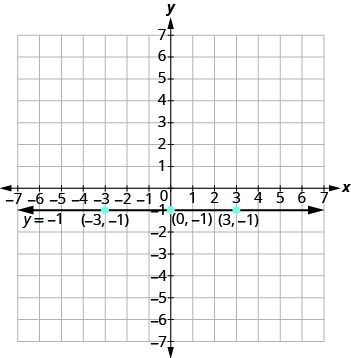
The equation has only variable, The value of is constant. All the ordered pairs in the table have the same -coordinate, . We choose and as values for
方程式の変数はだけで、の値は一定である。表のどの順序対も、座標は同じである。の値にはとを選ぶ。
The graph is a horizontal line passing through the -axis at as shown.
図のグラフは、軸上のを通る水平な直線である。
Try It (2)確認問題(2題)
The equations for vertical and horizontal lines look very similar to equations like What is the difference between the equations and
垂直な直線や水平な直線の方程式は、のような式とよく似ている。との違いは何だろうか。
The equation has both and The value of depends on the value of The changes according to the value of
方程式にはとの両方がある。の値はの値によって決まる。は、の値に応じて変わる。
The equation has only one variable. The value of is constant. The is always It does not depend on the value of
方程式の変数は1つだけである。の値は一定で、は常にである。の値にはよらない。
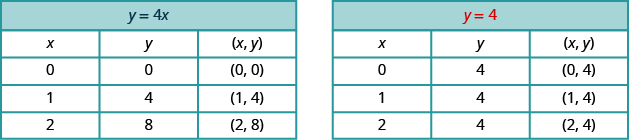
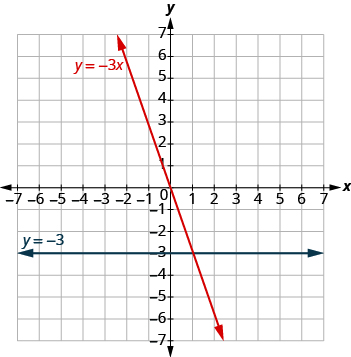
The graph shows both equations.
グラフには、両方の方程式が描かれている。
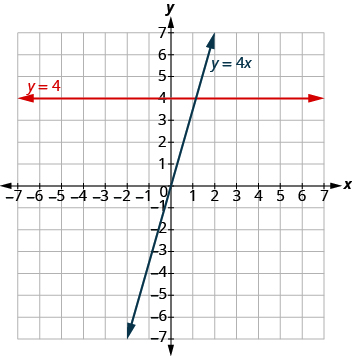
Notice that the equation gives a slanted line whereas gives a horizontal line.
英語のヒント
方程式のグラフは斜めの直線になるのに対し、のグラフは水平な直線になることに注目しよう。
Example 11.22例題 11.22
Graph and in the same rectangular coordinate system.
同じ直交座標平面に、とのグラフを描く。
Solution解答
Find three solutions for each equation. Notice that the first equation has the variable while the second does not. Solutions for both equations are listed.
各方程式の解を3つずつ求める。最初の方程式には変数があるが、2つ目にはないことに注目しよう。両方の方程式の解を表に示す。
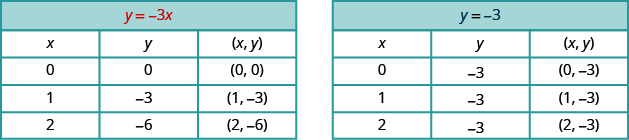
The graph shows both equations.
グラフには、両方の方程式が描かれている。