第12章反応速度
12.1 Chemical Reaction Rates12.1 化学反応速度
Learning Objectives学習目標
By the end of this section, you will be able to:
この節を終えると、次のことができるようになる。
- Define chemical reaction rate化学反応速度を定義する。
- Derive rate expressions from the balanced equation for a given chemical reaction与えられた化学反応の、係数のつり合った反応式から、速度の表式を導く。
- Calculate reaction rates from experimental data実験データから反応速度を計算する。
A rate is a measure of how some property varies with time. Speed is a familiar rate that expresses the distance traveled by an object in a given amount of time. Wage is a rate that represents the amount of money earned by a person working for a given amount of time. Likewise, the rate of a chemical reaction is a measure of how much reactant is consumed, or how much product is produced, by the reaction in a given amount of time.
英語のヒント
速度は、ある性質が時間とともにどのように変化するかを表す尺度である。速さは身近な速度の一つで、物体が一定の時間に移動する距離を表す。賃金は、一定の時間働いた人が稼ぐ金額を表す率である。同様に、化学反応の速度は、一定の時間に反応で消費される反応物の量、または生じる生成物の量を表す尺度である。
The rate of reaction is the change in the amount of a reactant or product per unit time. Reaction rates are therefore determined by measuring the time dependence of some property that can be related to reactant or product amounts. Rates of reactions that consume or produce gaseous substances, for example, are conveniently determined by measuring changes in volume or pressure. For reactions involving one or more colored substances, rates may be monitored via measurements of light absorption. For reactions involving aqueous electrolytes, rates may be measured via changes in a solution’s conductivity.
英語のヒント
反応速度とは、単位時間あたりの反応物または生成物の量の変化である。そのため、反応物や生成物の量と関係づけられる性質の時間変化を測定することで、反応速度を求める。たとえば気体を消費または生成する反応では、体積や圧力の変化を測れば便利である。一種類以上の有色物質を含む反応では、光の吸収を測って速度を追跡できる。水溶液中の電解質が関与する反応では、溶液の電気伝導度の変化から速度を測定できる。
For reactants and products in solution, their relative amounts (concentrations) are conveniently used for purposes of expressing reaction rates. For example, the concentration of hydrogen peroxide, H2O2, in an aqueous solution changes slowly over time as it decomposes according to the equation:
英語のヒント
溶液中の反応物や生成物については、相対的な量である濃度を使うと、反応速度を便利に表せる。たとえば、水溶液中の過酸化水素H2O2の濃度は、次の反応式に従って分解するにつれ、時間とともにゆっくり変わる。
The rate at which the hydrogen peroxide decomposes can be expressed in terms of the rate of change of its concentration, as shown here:
過酸化水素が分解する速度は、次のように、その濃度の変化速度で表せる。
This mathematical representation of the change in species concentration over time is the rate expression for the reaction. The brackets indicate molar concentrations, and the symbol delta (Δ) indicates “change in.” Thus, represents the molar concentration of hydrogen peroxide at some time t1; likewise, represents the molar concentration of hydrogen peroxide at a later time t2; and Δ[H2O2] represents the change in molar concentration of hydrogen peroxide during the time interval Δt (that is, t2 − t1). Since the reactant concentration decreases as the reaction proceeds, Δ[H2O2] is a negative quantity. Reaction rates are, by convention, positive quantities, and so this negative change in concentration is multiplied by −1. Figure 12.2 provides an example of data collected during the decomposition of H2O2.
英語のヒント
化学種の濃度の時間変化をこのように数学的に表したものが、この反応の速度の表式である。角括弧はモル濃度を、記号デルタ(Δ)は「変化」を表す。したがって、はある時刻t1の過酸化水素のモル濃度、同様にはそれより後の時刻t2のモル濃度を表す。Δ[H2O2]は、時間間隔Δt(すなわちt2 − t1)における過酸化水素のモル濃度の変化である。反応が進むと反応物の濃度は下がるため、Δ[H2O2]は負の量になる。反応速度は慣例によって正の量とするので、この負の濃度変化に−1を掛ける。図12.2に、H2O2の分解中に集めたデータの例を示す。
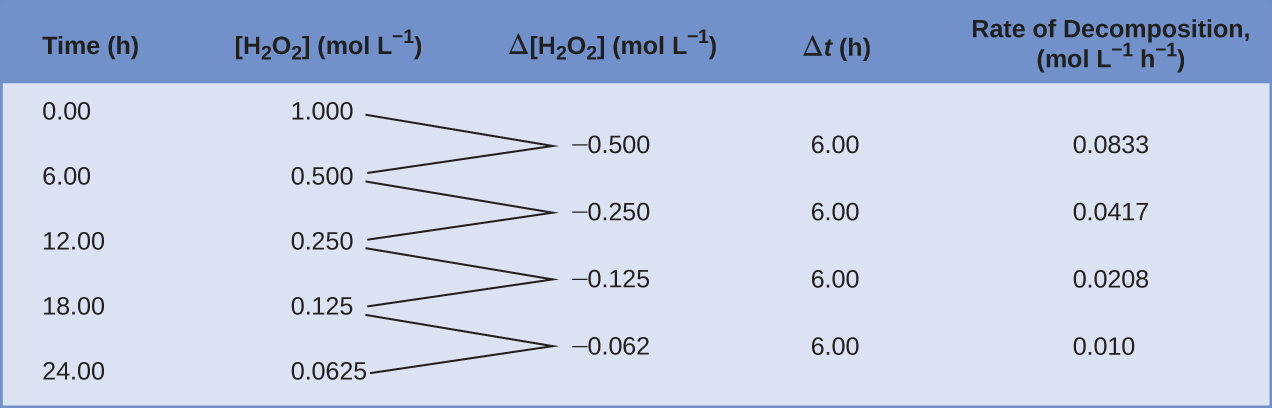
Figure 12.2図 12.2
The rate of decomposition of H2O2 in an aqueous solution decreases as the concentration of H2O2 decreases.
水溶液中のH2O2の分解速度は、H2O2の濃度が低下するにつれて小さくなる。
To obtain the tabulated results for this decomposition, the concentration of hydrogen peroxide was measured every 6 hours over the course of a day at a constant temperature of 40 °C. Reaction rates were computed for each time interval by dividing the change in concentration by the corresponding time increment, as shown here for the first 6-hour period:
英語のヒント
この分解について表に示した結果を得るため、温度を40 °Cに保ち、1日にわたって6時間ごとに過酸化水素の濃度を測定した。各時間区間の反応速度は、濃度変化を対応する経過時間で割って求めた。最初の6時間については、次のようになる。
Notice that the reaction rates vary with time, decreasing as the reaction proceeds. Results for the last 6-hour period yield a reaction rate of:
反応速度が時間とともに変わり、反応の進行につれて低下することに注目せよ。最後の6時間の結果からは、次の反応速度が得られる。
This behavior indicates the reaction continually slows with time. Using the concentrations at the beginning and end of a time period over which the reaction rate is changing results in the calculation of an average rate for the reaction over this time interval. At any specific time, the rate at which a reaction is proceeding is known as its instantaneous rate. The instantaneous rate of a reaction at “time zero,” when the reaction commences, is its initial rate. Consider the analogy of a car slowing down as it approaches a stop sign. The vehicle’s initial rate—analogous to the beginning of a chemical reaction—would be the speedometer reading at the moment the driver begins pressing the brakes (t0). A few moments later, the instantaneous rate at a specific moment—call it t1—would be somewhat slower, as indicated by the speedometer reading at that point in time. As time passes, the instantaneous rate will continue to fall until it reaches zero, when the car (or reaction) stops. Unlike instantaneous speed, the car’s average speed is not indicated by the speedometer; but it can be calculated as the ratio of the distance traveled to the time required to bring the vehicle to a complete stop (Δt). Like the decelerating car, the average rate of a chemical reaction will fall somewhere between its initial and final rates.
英語のヒント
この挙動は、反応が時間とともに絶えず遅くなることを示す。反応速度が変わる時間区間の始めと終わりの濃度を使って計算すると、その区間の平均速度が得られる。ある特定の時刻に反応が進む速度を、瞬間速度という。反応が始まる「時刻ゼロ」での瞬間速度が初速度である。停止標識に近づく車が減速する場合を考えてみよう。化学反応の始まりに相当する車の初速度は、運転者がブレーキを踏み始めた瞬間(t0)の速度計の表示である。少し後の特定の瞬間をt1とすると、そのときの瞬間速度は速度計が示すように、いくらか小さくなっている。時間がたつにつれて瞬間速度は下がり続け、車(または反応)が止まるとゼロになる。瞬間の速さとは違い、車の平均の速さは速度計に表示されない。しかし、移動距離を完全に停止するまでの時間(Δt)で割れば計算できる。減速する車と同様に、化学反応の平均速度は、初めと終わりの速度の間のどこかになる。
The instantaneous rate of a reaction may be determined one of two ways. If experimental conditions permit the measurement of concentration changes over very short time intervals, then average rates computed as described earlier provide reasonably good approximations of instantaneous rates. Alternatively, a graphical procedure may be used that, in effect, yields the results that would be obtained if short time interval measurements were possible. In a plot of the concentration of hydrogen peroxide against time, the instantaneous rate of decomposition of H2O2 at any time t is given by the slope of a straight line that is tangent to the curve at that time (Figure 12.3). These tangent line slopes may be evaluated using calculus, but the procedure for doing so is beyond the scope of this chapter.
英語のヒント
反応の瞬間速度は、二つの方法のいずれかで求められる。非常に短い時間間隔で濃度変化を測定できる実験条件なら、先ほどの方法で計算した平均速度が、瞬間速度のかなりよい近似になる。もう一つはグラフを使う方法である。これは実質的に、短い時間間隔の測定が可能だった場合に得られる結果を与える。過酸化水素の濃度を時間に対してプロットすると、任意の時刻tのH2O2の瞬間分解速度は、その時刻で曲線に接する直線の傾きで与えられる(図12.3)。接線の傾きは微積分で求められるが、その手順はこの章の範囲外である。
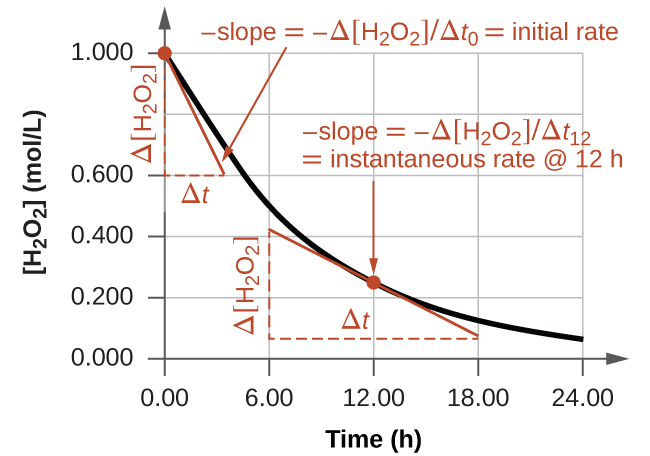


Figure 12.3図 12.3
This graph shows a plot of concentration versus time for a 1.000 M solution of H2O2. The rate at any time is equal to the negative of the slope of a line tangent to the curve at that time. Tangents are shown at t = 0 h (“initial rate”) and at t = 12 h (“instantaneous rate” at 12 h).
このグラフは、1.000 MのH2O2水溶液について、濃度を時間に対してプロットしたものである。任意の時刻での速度は、その時刻の曲線の接線の傾きに負号を付けた値に等しくなる。t = 0 h(「初速度」)とt = 12 h(12 hでの「瞬間速度」)の接線を示している。