第6章電子構造と元素の周期的性質
Blackbody Radiation and the Ultraviolet Catastrophe黒体放射と紫外破綻
The last few decades of the nineteenth century witnessed intense research activity in commercializing newly discovered electric lighting. This required obtaining a better understanding of the distributions of light emitted from various sources being considered. Artificial lighting is usually designed to mimic natural sunlight within the limitations of the underlying technology. Such lighting consists of a range of broadly distributed frequencies that form a continuous spectrum. Figure 6.9 shows the wavelength distribution for sunlight. The most intense radiation is in the visible region, with the intensity dropping off rapidly for shorter wavelength ultraviolet (UV) light, and more slowly for longer wavelength infrared (IR) light.
英語のヒント
19世紀最後の数十年間には、新たに発見された電気照明の実用化に向けて、研究が盛んに行われた。そのためには、候補となるさまざまな光源が放つ光の分布を、よりよく理解する必要があった。人工照明は通常、用いる技術の制約の範囲内で、自然の太陽光をまねるように設計される。このような照明の光には、広い範囲に分布する振動数が含まれ、連続スペクトルを形成している。図6.9は、太陽光の波長分布を示している。放射が最も強いのは可視領域である。より短い波長の紫外線(UV)側では強度が急激に低下し、より長い波長の赤外線(IR)側では、より緩やかに低下する。
Image omitted because its reuse rights could not be verified.権利の確認ができないため画像を割愛。
Figure 6.9図 6.9
The spectral distribution (light intensity vs. wavelength) of sunlight reaches the Earth's atmosphere as UV light, visible light, and IR light. The unabsorbed sunlight at the top of the atmosphere has a distribution that approximately matches the theoretical distribution of a blackbody at 5250 °C, represented by the blue curve. (credit: modification of work by American Society for Testing and Materials (ASTM) Terrestrial Reference Spectra for Photovoltaic Performance Evaluation)
太陽光のスペクトル分布(光の強度と波長の関係)は、紫外線、可視光線、赤外線として地球の大気に到達する。大気上端での、まだ吸収されていない太陽光の分布は、青い曲線で示した5250 °Cの黒体の理論的な分布とほぼ一致する。(出典:米国材料試験協会〈ASTM〉「太陽電池性能評価用の地上基準スペクトル」を改変)
In Figure 6.9, the solar distribution is compared to a representative distribution, called a blackbody spectrum, that corresponds to a temperature of 5250 °C. The blackbody spectrum matches the solar spectrum quite well. A blackbody is a convenient, ideal emitter that approximates the behavior of many materials when heated. It is “ideal” in the same sense that an ideal gas is a convenient, simple representation of real gases that works well, provided that the pressure is not too high nor the temperature too low. A good approximation of a blackbody that can be used to observe blackbody radiation is a metal oven that can be heated to very high temperatures. The oven has a small hole allowing for the light being emitted within the oven to be observed with a spectrometer so that the wavelengths and their intensities can be measured. Figure 6.10 shows the resulting curves for some representative temperatures. Each distribution depends only on a single parameter: the temperature. The maxima in the blackbody curves, λmax, shift to shorter wavelengths as the temperature increases, reflecting the observation that metals being heated to high temperatures begin to glow a darker red that becomes brighter as the temperature increases, eventually becoming white hot at very high temperatures as the intensities of all of the visible wavelengths become appreciable. This common observation was at the heart of the first paradox that showed the fundamental limitations of classical physics that we will examine.
英語のヒント
図6.9では、太陽光の分布を、黒体スペクトルと呼ばれる代表的な分布と比較している。この黒体スペクトルは5250 °Cに対応し、太陽光のスペクトルとよく一致している。黒体は、加熱した多くの物質の振る舞いを近似する、扱いやすい理想的な放射体である。ここでいう「理想的」とは、理想気体が実在気体を単純に表す便利なモデルであり、圧力が高すぎず温度が低すぎなければよく成り立つ、というのと同じ意味である。非常に高温まで加熱できる金属製の炉は、黒体のよい近似となり、黒体放射の観測に利用できる。炉には小さな穴があり、内部から放出される光を分光計で観測して、波長とその強度を測定できる。いくつかの代表的な温度で得られる曲線を図6.10に示す。各分布は、温度というただ1つのパラメーターだけで決まる。黒体の曲線が最大となる波長λmaxは、温度が上がるほど短波長側へ移る。これは、高温に加熱された金属がまず暗い赤色に光り始め、温度の上昇とともに明るくなり、非常に高温になると可視光のどの波長の強度も相当な大きさになって、ついには白熱するという観察に対応している。この身近な観察は、これから取り上げる、古典物理学の根本的な限界を示した最初の矛盾の核心にあった。
Physicists derived mathematical expressions for the blackbody curves using well-accepted concepts from the theories of classical mechanics and classical electromagnetism. The theoretical expressions as functions of temperature fit the observed experimental blackbody curves well at longer wavelengths, but showed significant discrepancies at shorter wavelengths. Not only did the theoretical curves not show a peak, they absurdly showed the intensity becoming infinitely large as the wavelength became smaller, which would imply that everyday objects at room temperature should be emitting large amounts of UV light. This became known as the “ultraviolet catastrophe” because no one could find any problems with the theoretical treatment that could lead to such unrealistic short-wavelength behavior. Finally, around 1900, Max Planck derived a theoretical expression for blackbody radiation that fit the experimental observations exactly (within experimental error). Planck developed his theoretical treatment by extending the earlier work that had been based on the premise that the atoms composing the oven vibrated at increasing frequencies (or decreasing wavelengths) as the temperature increased, with these vibrations being the source of the emitted electromagnetic radiation. But where the earlier treatments had allowed the vibrating atoms to have any energy values obtained from a continuous set of energies (perfectly reasonable, according to classical physics), Planck found that by restricting the vibrational energies to discrete values for each frequency, he could derive an expression for blackbody radiation that correctly had the intensity dropping rapidly for the short wavelengths in the UV region.
英語のヒント
物理学者たちは、古典力学と古典電磁気学の理論で広く受け入れられていた概念を使い、黒体の曲線を表す数式を導いた。温度の関数として表した理論式は、長波長では実験で観測された黒体の曲線によく合ったが、短波長では大きなずれを示した。理論の曲線にはピークが現れないばかりか、波長が短くなるほど強度が無限大になるという、不合理な結果になった。これでは、室温の日用品が大量の紫外線を放出しているはずだということになる。この問題は「紫外破綻」と呼ばれるようになった。このような非現実的な短波長での振る舞いを引き起こすような問題点を、理論の扱いの中に誰も見いだせなかったためである。ついに1900年ごろ、マックス・プランクは、実験の観測結果と実験誤差の範囲でぴったり一致する黒体放射の理論式を導いた。プランクは、それ以前の研究を発展させることで理論を組み立てた。その研究では、炉を構成する原子は温度の上昇とともに、より高い振動数(より短い波長)で振動し、この振動が放出される電磁放射の源であると仮定していた。それまでの扱いでは、振動する原子は連続的なエネルギーの集合から任意の値をとれるとされていた。古典物理学からすれば、これはまったく妥当な仮定であった。しかしプランクは、振動のエネルギーを振動数ごとに離散的な値に制限すると、紫外領域の短波長で強度が急減する、正しい黒体放射の式を導けることを見いだした。
The quantity h is a constant now known as Planck's constant, in his honor. Although Planck was pleased he had resolved the blackbody radiation paradox, he was disturbed that to do so, he needed to assume the vibrating atoms required quantized energies, which he was unable to explain. The value of Planck's constant is very small, 6.626 10−34 joule seconds (J s), which helps explain why energy quantization had not been observed previously in macroscopic phenomena.
英語のヒント
hという量は、プランクを記念して現在ではプランク定数と呼ばれる定数である。プランクは黒体放射の矛盾を解決できたことを喜んだが、そのためには振動する原子のエネルギーが量子化されていると仮定する必要があり、その理由を説明できないことに困惑していた。プランク定数の値は6.626 10−34ジュール秒(J s)と非常に小さい。このことは、エネルギーの量子化がそれまで巨視的な現象で観測されていなかった理由の説明に役立つ。
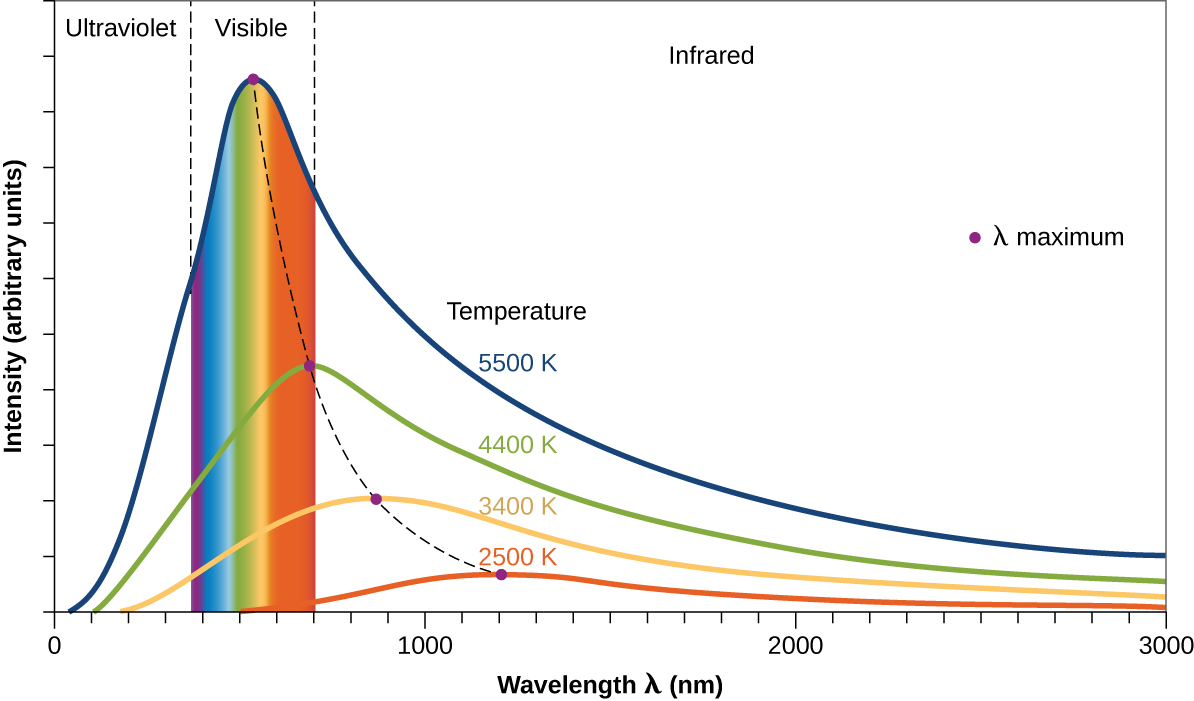

Figure 6.10図 6.10
Blackbody spectral distribution curves are shown for some representative temperatures.
いくつかの代表的な温度での、黒体のスペクトル分布曲線。