第2章極限
2.2 The Limit of a Function2.2 関数の極限
Learning Objectives学習目標
- Using correct notation, describe the limit of a function.正しい記号を使って、関数の極限を表す。
- Use a table of values to estimate the limit of a function or to identify when the limit does not exist.値の表を使って関数の極限を推定し、極限が存在しない場合を見分ける。
- Use a graph to estimate the limit of a function or to identify when the limit does not exist.グラフを使って関数の極限を推定し、極限が存在しない場合を見分ける。
- Define one-sided limits and provide examples.片側極限を定義し、例を挙げる。
- Explain the relationship between one-sided and two-sided limits.片側極限と両側極限の関係を説明する。
- Using correct notation, describe an infinite limit.正しい記号を使って、無限大への発散を表す。
- Define a vertical asymptote.垂直漸近線を定義する。
The concept of a limit or limiting process, essential to the understanding of calculus, has been around for thousands of years. In fact, early mathematicians used a limiting process to obtain better and better approximations of areas of circles. Yet, the formal definition of a limit—as we know and understand it today—did not appear until the late 19th century. We therefore begin our quest to understand limits, as our mathematical ancestors did, by using an intuitive approach. At the end of this chapter, armed with a conceptual understanding of limits, we examine the formal definition of a limit.
英語のヒント
微積分の理解に欠かせない極限、あるいは極限操作の考え方は、何千年も前から存在していた。実際、古代の数学者は極限操作を用いて、円の面積をより正確に近似していた。しかし、現在私たちが理解しているような極限の厳密な定義が現れたのは、19世紀後半になってからである。そこで、数学の先人たちと同じように、まず直感的な方法で極限の理解を始めよう。この章の最後では、極限の概念を理解したうえで、厳密な定義を調べる。
We begin our exploration of limits by taking a look at the graphs of the functions
次の関数のグラフを見て、極限の探究を始めよう。
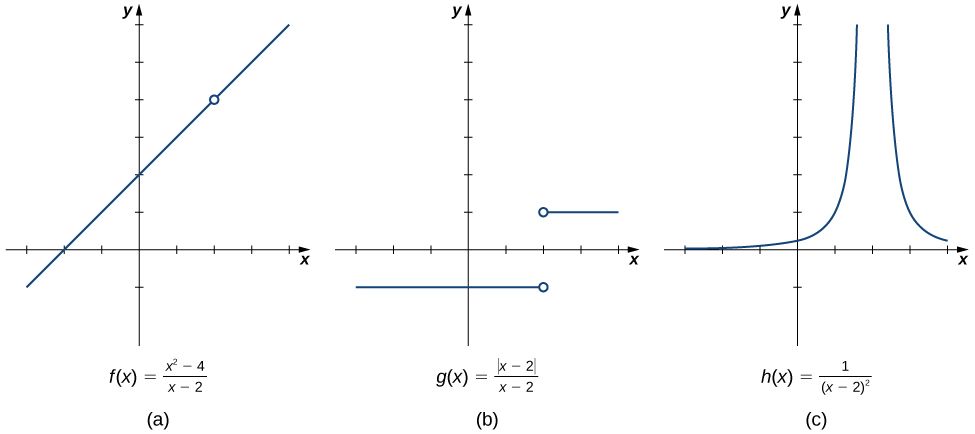
which are shown in Figure 2.12. In particular, let’s focus our attention on the behavior of each graph at and around
これらのグラフを図2.12に示す。特に、とその周辺での各グラフの振る舞いに注目しよう。
OpenStax, Rice University; Calculus Volume 1. · CC BY-NC-SA 4.0
Figure 2.12図 2.12
These graphs show the behavior of three different functions around
3つの異なる関数について、付近での振る舞いを示したグラフ。
Each of the three functions is undefined at but if we make this statement and no other, we give a very incomplete picture of how each function behaves in the vicinity of To express the behavior of each graph in the vicinity of 2 more completely, we need to introduce the concept of a limit.
英語のヒント
この3つの関数は、いずれもでは定義されていない。しかし、それだけを述べても、付近で各関数がどう振る舞うかは、ほとんど伝わらない。2の近くでのグラフの様子をより十分に表すには、極限という概念が必要になる。
Intuitive Definition of a Limit極限の直感的な定義
Let’s first take a closer look at how the function behaves around in Figure 2.12. As the values of x approach 2 from either side of 2, the values of approach 4. Mathematically, we say that the limit of as x approaches 2 is 4. Symbolically, we express this limit as
英語のヒント
まず図2.12で、関数が付近でどう振る舞うか、詳しく見よう。xを2の左右どちらから近づけても、は4に近づく。数学では、これを「xが2に近づくときのの極限は4である」という。記号では、次のように表す。
From this very brief informal look at one limit, let’s start to develop an intuitive definition of the limit. We can think of the limit of a function at a number a as being the one real number L that the functional values approach as the x-values approach a, provided such a real number L exists. Stated more carefully, we have the following definition:
英語のヒント
1つの極限を大まかに見たところで、極限の直感的な定義を考えよう。ある数aでの関数の極限とは、xの値をaに近づけるとき、関数の値が近づくただ1つの実数Lだと考えられる。そのような実数Lが存在する場合の話である。より丁寧に述べると、次の定義になる。
We can estimate limits by constructing tables of functional values and by looking at their graphs. This process is described in the following Problem-Solving Strategy.
関数の値の表を作ったり、グラフを調べたりすることで、極限を推定できる。その手順を、次の解法の指針にまとめる。
We apply this Problem-Solving Strategy to compute a limit in Example 2.4.
例題2.4では、この解法の指針を使って極限を求める。
Example 2.4例題 2.4
Evaluating a Limit Using a Table of Functional Values 1関数の値の表から極限を求める(1)
Evaluate using a table of functional values.
関数の値の表を使って、を求めなさい。
Solution解き方
x |
x |
|||
|---|---|---|---|---|
−0.1 |
0.998334166468 |
0.1 |
0.998334166468 |
|
−0.01 |
0.999983333417 |
0.01 |
0.999983333417 |
|
−0.001 |
0.999999833333 |
0.001 |
0.999999833333 |
|
−0.0001 |
0.999999998333 |
0.0001 |
0.999999998333 |
Note: The values in this table were obtained using a calculator and using all the places given in the calculator output.
この表の数値は電卓で求め、表示された桁をすべて用いている。
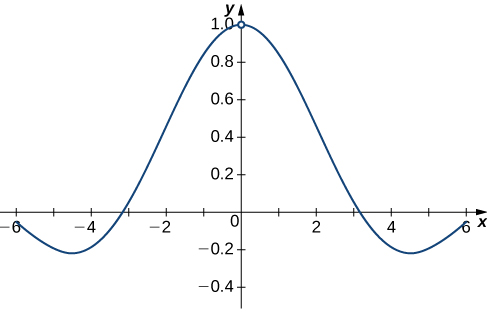
As we read down each column, we see that the values in each column appear to be approaching one. Thus, it is fairly reasonable to conclude that A calculator or computer-generated graph of would be similar to that shown in Figure 2.13, and it confirms our estimate.
英語のヒント
の各列を下へ読むと、どちらの列の値も1に近づいているように見える。したがって、と結論づけるのは十分もっともらしい。電卓やコンピューターでを描くと、図2.13のようなグラフが得られ、この推定を裏づけている。
OpenStax, Rice University; Calculus Volume 1. · CC BY-NC-SA 4.0
Figure 2.13図 2.13
Example 2.5例題 2.5
Evaluating a Limit Using a Table of Functional Values 2関数の値の表から極限を求める(2)
Evaluate using a table of functional values.
関数の値の表を使って、を求めなさい。
Solution解き方
As before, we use a table—in this case, Table 2.3—to list the values of the function for the given values of x.
前と同じように、指定されたxの値に対する関数の値を表にまとめる。ここでは表2.3を用いる。
x |
x |
|||
|---|---|---|---|---|
3.9 |
0.251582341869 |
4.1 |
0.248456731317 |
|
3.99 |
0.25015644562 |
4.01 |
0.24984394501 |
|
3.999 |
0.250015627 |
4.001 |
0.249984377 |
|
3.9999 |
0.250001563 |
4.0001 |
0.249998438 |
|
3.99999 |
0.25000016 |
4.00001 |
0.24999984 |
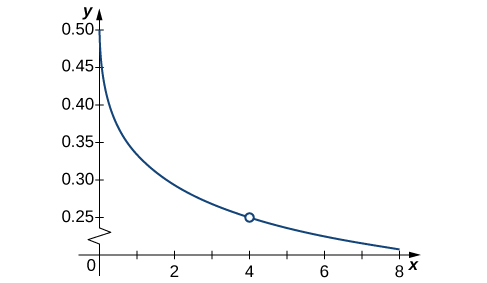
After inspecting this table, we see that the functional values less than 4 appear to be decreasing toward 0.25 whereas the functional values greater than 4 appear to be increasing toward 0.25. We conclude that We confirm this estimate using the graph of shown in Figure 2.14.
表を見ると、xが4より小さい側では関数の値が0.25へ向かって減少し、xが4より大きい側では0.25へ向かって増加しているように見える。したがって、と結論づける。図2.14ののグラフも、この推定を裏づける。
OpenStax, Rice University; Calculus Volume 1. · CC BY-NC-SA 4.0
Figure 2.14図 2.14
At this point, we see from Example 2.4 and Example 2.5 that it may be just as easy, if not easier, to estimate a limit of a function by inspecting its graph as it is to estimate the limit by using a table of functional values. In Example 2.6, we evaluate a limit exclusively by looking at a graph rather than by using a table of functional values.
英語のヒント
Example 2.6例題 2.6
Evaluating a Limit Using a Graphグラフから極限を求める
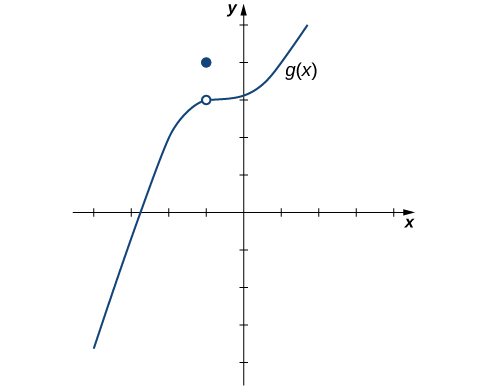
For shown in Figure 2.15, evaluate
図2.15に示すについて、を求めなさい。
OpenStax, Rice University; Calculus Volume 1. · CC BY-NC-SA 4.0
Figure 2.15図 2.15
The graph of includes one value not on a smooth curve.
のグラフには、滑らかな曲線から外れた値が1つある。
Solution解き方
Despite the fact that as the x-values approach −1 from either side, the values approach 3. Therefore, Note that we can determine this limit without even knowing the algebraic expression of the function.
英語のヒント
であるにもかかわらず、xを左右どちらから−1に近づけても、の値は3に近づく。したがって、である。関数を表す代数式が分からなくても、この極限は求められる。
Based on Example 2.6, we make the following observation: It is possible for the limit of a function to exist at a point, and for the function to be defined at this point, but the limit of the function and the value of the function at the point may be different.
英語のヒント
例題2.6から、次のことが分かる。ある点で関数の極限が存在し、しかもその点で関数が定義されていても、極限の値とその点での関数の値が異なる場合がある。
Looking at a table of functional values or looking at the graph of a function provides us with useful insight into the value of the limit of a function at a given point. However, these techniques rely too much on guesswork. We eventually need to develop alternative methods of evaluating limits. These new methods are more algebraic in nature and we explore them in the next section; however, at this point we introduce two special limits that are foundational to the techniques to come.
英語のヒント
関数の値の表やグラフを見ると、ある点での極限の値を考えるうえで役に立つ。しかし、これらの方法は推測に頼りすぎている。いずれは、別の方法で極限を求める必要がある。次の節では、より代数的な方法を調べる。その前に、これからの手法の基礎になる、2つの特別な極限を紹介する。
We can make the following observations about these two limits.
この2つの極限について、次のように考えられる。
- For the first limit, observe that as x approaches a, so does because Consequently,第1の極限では、xがaに近づくと、もaに近づく。だからである。したがって、となる。
x |
x |
|||
|---|---|---|---|---|
c |
c |
|||
c |
c |
|||
c |
c |
|||
c |
c |
Observe that for all values of x (regardless of whether they are approaching a), the values remain constant at c. We have no choice but to conclude
英語のヒント
xがaに近づいているかどうかにかかわらず、どのxでもの値はcのままである。したがって、と結論づけられる。